FORM 10-K IMPERIAL OIL LIMITED
FORM 10-K IMPERIAL OIL LIMITED
FORM 10-K IMPERIAL OIL LIMITED

Create successful ePaper yourself
Turn your PDF publications into a flip-book with our unique Google optimized e-Paper software.
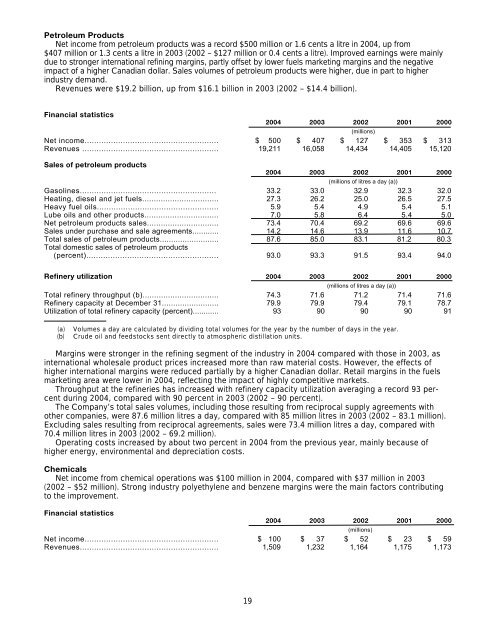
Petroleum Products<br />
Net income from petroleum products was a record $500 million or 1.6 cents a litre in 2004, up from<br />
$407 million or 1.3 cents a litre in 2003 (2002 – $127 million or 0.4 cents a litre). Improved earnings were mainly<br />
due to stronger international refining margins, partly offset by lower fuels marketing margins and the negative<br />
impact of a higher Canadian dollar. Sales volumes of petroleum products were higher, due in part to higher<br />
industry demand.<br />
Revenues were $19.2 billion, up from $16.1 billion in 2003 (2002 – $14.4 billion).<br />
Financial statistics<br />
2004 2003 2002 2001 2000<br />
(millions)<br />
Net income........................................................ $ 500 $ 407 $ 127 $ 353 $ 313<br />
Revenues ......................................................... 19,211 16,058 14,434 14,405 15,120<br />
Sales of petroleum products<br />
2004 2003 2002 2001 2000<br />
(millions of litres a day (a))<br />
Gasolines......................................................... 33.2 33.0 32.9 32.3 32.0<br />
Heating, diesel and jet fuels................................. 27.3 26.2 25.0 26.5 27.5<br />
Heavy fuel oils................................................... 5.9 5.4 4.9 5.4 5.1<br />
Lube oils and other products................................ 7.0 5.8 6.4 5.4 5.0<br />
Net petroleum products sales............................... 73.4 70.4 69.2 69.6 69.6<br />
Sales under purchase and sale agreements............ 14.2 14.6 13.9 11.6 <strong>10</strong>.7<br />
Total sales of petroleum products.......................... 87.6 85.0 83.1 81.2 80.3<br />
Total domestic sales of petroleum products<br />
(percent)....................................................... 93.0 93.3 91.5 93.4 94.0<br />
Refinery utilization 2004 2003 2002 2001 2000<br />
(millions of litres a day (a))<br />
Total refinery throughput (b)................................. 74.3 71.6 71.2 71.4 71.6<br />
Refinery capacity at December 31......................... 79.9 79.9 79.4 79.1 78.7<br />
Utilization of total refinery capacity (percent)............ 93 90 90 90 91<br />
(a)<br />
(b)<br />
Volumes a day are calculated by dividing total volumes for the year by the number of days in the year.<br />
Crude oil and feedstocks sent directly to atmospheric distillation units.<br />
Margins were stronger in the refining segment of the industry in 2004 compared with those in 2003, as<br />
international wholesale product prices increased more than raw material costs. However, the effects of<br />
higher international margins were reduced partially by a higher Canadian dollar. Retail margins in the fuels<br />
marketing area were lower in 2004, reflecting the impact of highly competitive markets.<br />
Throughput at the refineries has increased with refinery capacity utilization averaging a record 93 percent<br />
during 2004, compared with 90 percent in 2003 (2002 – 90 percent).<br />
The Company’s total sales volumes, including those resulting from reciprocal supply agreements with<br />
other companies, were 87.6 million litres a day, compared with 85 million litres in 2003 (2002 – 83.1 million).<br />
Excluding sales resulting from reciprocal agreements, sales were 73.4 million litres a day, compared with<br />
70.4 million litres in 2003 (2002 – 69.2 million).<br />
Operating costs increased by about two percent in 2004 from the previous year, mainly because of<br />
higher energy, environmental and depreciation costs.<br />
Chemicals<br />
Net income from chemical operations was $<strong>10</strong>0 million in 2004, compared with $37 million in 2003<br />
(2002 – $52 million). Strong industry polyethylene and benzene margins were the main factors contributing<br />
to the improvement.<br />
Financial statistics<br />
2004 2003 2002 2001 2000<br />
(millions)<br />
Net income........................................................ $ <strong>10</strong>0 $ 37 $ 52 $ 23 $ 59<br />
Revenues.......................................................... 1,509 1,232 1,164 1,175 1,173<br />
19