FORM 10-K IMPERIAL OIL LIMITED
FORM 10-K IMPERIAL OIL LIMITED
FORM 10-K IMPERIAL OIL LIMITED
You also want an ePaper? Increase the reach of your titles
YUMPU automatically turns print PDFs into web optimized ePapers that Google loves.
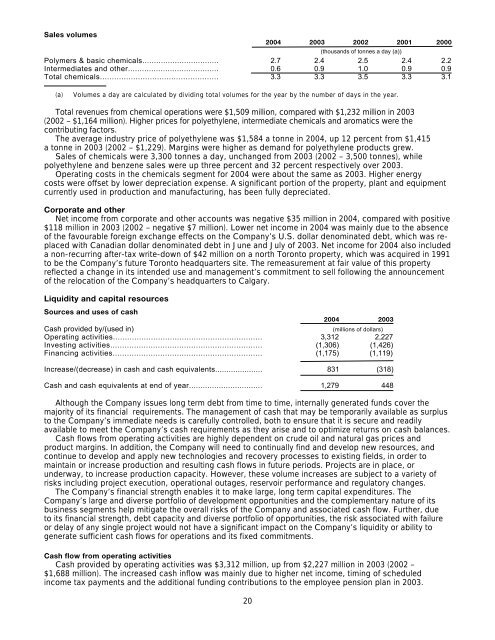
Sales volumes<br />
2004 2003 2002 2001 2000<br />
(thousands of tonnes a day (a))<br />
Polymers & basic chemicals................................. 2.7 2.4 2.5 2.4 2.2<br />
Intermediates and other....................................... 0.6 0.9 1.0 0.9 0.9<br />
Total chemicals.................................................. 3.3 3.3 3.5 3.3 3.1<br />
(a)<br />
Volumes a day are calculated by dividing total volumes for the year by the number of days in the year.<br />
Total revenues from chemical operations were $1,509 million, compared with $1,232 million in 2003<br />
(2002 – $1,164 million). Higher prices for polyethylene, intermediate chemicals and aromatics were the<br />
contributing factors.<br />
The average industry price of polyethylene was $1,584 a tonne in 2004, up 12 percent from $1,415<br />
a tonne in 2003 (2002 – $1,229). Margins were higher as demand for polyethylene products grew.<br />
Sales of chemicals were 3,300 tonnes a day, unchanged from 2003 (2002 – 3,500 tonnes), while<br />
polyethylene and benzene sales were up three percent and 32 percent respectively over 2003.<br />
Operating costs in the chemicals segment for 2004 were about the same as 2003. Higher energy<br />
costs were offset by lower depreciation expense. A significant portion of the property, plant and equipment<br />
currently used in production and manufacturing, has been fully depreciated.<br />
Corporate and other<br />
Net income from corporate and other accounts was negative $35 million in 2004, compared with positive<br />
$118 million in 2003 (2002 – negative $7 million). Lower net income in 2004 was mainly due to the absence<br />
of the favourable foreign exchange effects on the Company’s U.S. dollar denominated debt, which was replaced<br />
with Canadian dollar denominated debt in June and July of 2003. Net income for 2004 also included<br />
a non-recurring after-tax write-down of $42 million on a north Toronto property, which was acquired in 1991<br />
to be the Company’s future Toronto headquarters site. The remeasurement at fair value of this property<br />
reflected a change in its intended use and management’s commitment to sell following the announcement<br />
of the relocation of the Company’s headquarters to Calgary.<br />
Liquidity and capital resources<br />
Sources and uses of cash<br />
20<br />
2004 2003<br />
Cash provided by/(used in) (millions of dollars)<br />
Operating activities............................................................... 3,312 2,227<br />
Investing activities................................................................ (1,306) (1,426)<br />
Financing activities............................................................... (1,175) (1,119)<br />
Increase/(decrease) in cash and cash equivalents..................... 831 (318)<br />
Cash and cash equivalents at end of year................................ 1,279 448<br />
Although the Company issues long term debt from time to time, internally generated funds cover the<br />
majority of its financial requirements. The management of cash that may be temporarily available as surplus<br />
to the Company’s immediate needs is carefully controlled, both to ensure that it is secure and readily<br />
available to meet the Company’s cash requirements as they arise and to optimize returns on cash balances.<br />
Cash flows from operating activities are highly dependent on crude oil and natural gas prices and<br />
product margins. In addition, the Company will need to continually find and develop new resources, and<br />
continue to develop and apply new technologies and recovery processes to existing fields, in order to<br />
maintain or increase production and resulting cash flows in future periods. Projects are in place, or<br />
underway, to increase production capacity. However, these volume increases are subject to a variety of<br />
risks including project execution, operational outages, reservoir performance and regulatory changes.<br />
The Company’s financial strength enables it to make large, long term capital expenditures. The<br />
Company’s large and diverse portfolio of development opportunities and the complementary nature of its<br />
business segments help mitigate the overall risks of the Company and associated cash flow. Further, due<br />
to its financial strength, debt capacity and diverse portfolio of opportunities, the risk associated with failure<br />
or delay of any single project would not have a significant impact on the Company’s liquidity or ability to<br />
generate sufficient cash flows for operations and its fixed commitments.<br />
Cash flow from operating activities<br />
Cash provided by operating activities was $3,312 million, up from $2,227 million in 2003 (2002 –<br />
$1,688 million). The increased cash inflow was mainly due to higher net income, timing of scheduled<br />
income tax payments and the additional funding contributions to the employee pension plan in 2003.


