Ore Bin / Oregon Geology magazine / journal - Oregon Department ...
Ore Bin / Oregon Geology magazine / journal - Oregon Department ...
Ore Bin / Oregon Geology magazine / journal - Oregon Department ...

Create successful ePaper yourself
Turn your PDF publications into a flip-book with our unique Google optimized e-Paper software.
2. Removal of the heavy magnetic minerals from the nonmagnetic<br />
heavy minerals by the use of a hand magnet and a Frantz<br />
magnetic separator.<br />
3. Ren10val of the intermediate minerals from the VHNM minerals<br />
at a sp gr of 4.2 by the use of a tungsten carbide-sodium<br />
po]ytungstate mixture.<br />
The purpose of the sodium poly tungstate separation was to<br />
achieve a separation of the fine fraction at a sp gr ::; 3.0, e.g.,<br />
removal of the light minerals such as quartz and feldspar. The<br />
sample was stirred into the solution and allowed to settle for about<br />
12 hours. Once separation had occurred, the light minerals were<br />
isolated by carefully immersing the beaker of solution into liquid<br />
nitrogen. The lighter particles were decanted, and the heavier particles,<br />
after thawing, were thoroughly washed in a filter to avoid<br />
Na and W contamination. After washing, the heavy fraction was<br />
dried in an oven at 80°C for 12 hours (or overnight).<br />
The magnetic separation process removed the magnetic fraction<br />
of the sample. A hand magnet was used first for the removal<br />
of strongly magnetic substances such as magnetite. This method<br />
was efficient and averted subsequent clogging in the Frantz isodynamic<br />
magnetic separator, in which standard settings were used<br />
for a more complete separation of the magnetic and nonmagnetic<br />
fractions.<br />
After the Frantz separation, a mixture of tungsten carbide and<br />
sodium poly tungstate was used to separate the VHNM fraction<br />
from the less dense nonmagnetic fraction. Zircon and rutile resided<br />
in the VHNM fraction (sp gr 4.6-4.7 and 4.2-4.3, respectively).<br />
After the separation process was completed. the VHNM fraction<br />
was examined under a microscope using a standard petrographic<br />
analysis method (Phillips and Griffen. 1981) and was found to<br />
consist mainly of translucent nonisometric minerals and trace<br />
amounts of opaque minerals. The VHNM samples were then<br />
weighed and heat sealed with a quartz rod into clean :V27-dram<br />
vials for analysis.<br />
METHOD OF ANALYSIS<br />
Sequential instrumental neutron activation analysis (INAA) was<br />
used to analyze the VHNM samples and determine elemental concentrations<br />
(Laul, 1979). Four reference standards were used: fly-ash<br />
powder (NBS 1633a), Columbia River Basalt Group powder<br />
(CRB3), a liquid U standard, and a liquid Zr standard. The CRB3<br />
standard is an <strong>Ore</strong>gon State University (OSU) standard that has<br />
been calibrated with the USGS BCR-l standard rock. The VHNM<br />
irradiation samples had masses in the range of 20 to 160 mg,<br />
although one sample had a mass of < 10 mg (all that was available).<br />
The samples and the standards were irradiated under identical conditions<br />
in the OSU TRIGA Reactor. The reactor was operated<br />
at a power level of 1 MW, corresponding to a thermal neutron<br />
flux of 1 x 10¹³ nlcm 2 -s in the ~newnatic transfer system (for<br />
the short irradiations) and 3 x 10 2 n/cm 2 -s in the rotating rack<br />
(for the long irradiations).<br />
For short irradiations, the samples were irradiated for two minutes<br />
and then allowed to decay for 10 minutes. The short-lived<br />
nuclides (representative of the elements Ti, AI, V, Mg, and Ca)<br />
were analyzed first for five minutes. After two to five hours, the<br />
samples were reanalyzed for 10 minutes to determine the elemental<br />
contents of Dy, Na, K, and Mn.<br />
For the long irradiation, the samples and the standards were<br />
irradiated for seven hours. After a decay period of seven to 14<br />
days, the samples were analyzed for three hours to determine the<br />
elemental concentrations of Fe, Co, As. Sb, Rb, Ba, La, Nd, Sm,<br />
Yb, Lu, W, and Np (representativeofU). The samples were allowed<br />
to decay for an additional 20 to 30 days and then analyzed for<br />
six hours to measure the concentrations of Sc, Cr, Co, Zn, Se.<br />
Sr, Sb, Cs, Ce, Eu, Th, Zr, Hf, Ta, and Pa (representative of Th).<br />
The data were collected using a p-type Princeton Gamma Tech<br />
Ge(Li) detector with a 13-percent efficiency (relative to a 7.62-cm<br />
by 7.62-cm NaI [Til detector at 1,332 keY) and a peak to Compton<br />
ratio of 47:1 at 1,332 keY. Dead times did not exceed 10 percent<br />
for any of the samples.<br />
RESULTS<br />
Results are referenced to the VHNM fraction sample masses,<br />
i.e., concentrations are expressed in parts per million (ppm) as<br />
Ilg of element per g of VHNM sample. Table 1 shows the concentrations<br />
(as ppm) of the major, minor, and trace elements in<br />
the VHNM samples,<br />
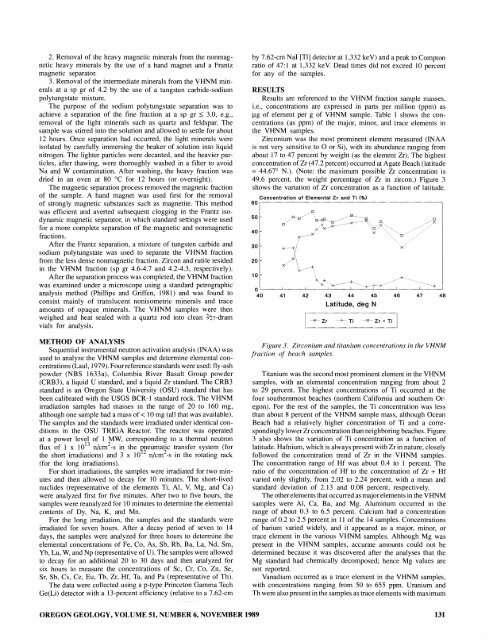
Zirconium was the most prominent element measured (INAA<br />
is not very sensitive to 0 or Si), with its abundance ranging from<br />
about 17 to 47 percent by weight (as the element Zr). The highest<br />
concentration of Zr (47.2 percent) occurred at Agate Beach (latitude<br />
'" 44.67° N.). (Note: the maximum possible Zr concentration is<br />
49.6 percent, the weight percentage of Zr in zircon.) Figure 3<br />
shows the variation of Zr concentration as a function of latitude.<br />
Concentration of Elemental Zr and Ti (%)<br />
60,---------------------------------------------,<br />
50<br />
40<br />
30<br />
20<br />
10<br />
o<br />
40<br />
+ x:/ /,\<br />
~<br />
~,<br />
'.'+<br />
-----"-_...--1.--.:1, +- /~_·+5v~_'··~'<br />
41 42 43 44 45<br />
Latitude, deg N<br />
I ~'_zr_ +"'_T_i _-_-8_,., Zr + iiJ<br />
46<br />
,-~.+<br />
47 48<br />
Figure 3. Zirconium and titanium concentrations in the VHNM<br />
fraction of beach samples.<br />
Titanium was the second most prominent element in the VHNM<br />
samples, with an elemental concentration ranging from about 2<br />
to 29 percent. The highest concentrations of Ti occurred at the<br />
four southernmost beaches (northern California and southern <strong>Ore</strong>gon).<br />
For the rest of the samples, the Ti concentration was less<br />
than about 8 percent of the VHNM sample mass, although Ocean<br />
Beach had a relatively higher concentration of Ti and a correspondinglylower<br />
Zrconcentration than neighboring beaches. Figure<br />
3 also shows the variation of Ti concentration as a function of<br />
latitude. Hafnium, which is always present with Zr in nature, closely<br />
followed the concentration trend of Zr in the VHNM samples.<br />
The concentration range of Hf was about 0.4 to I percent. The<br />
ratio of the concentration of Hf to the concentration of Zr + Hf<br />
varied only slightly, from 2.02 to 2.24 percent, with a mean and<br />
standard deviation of 2.13 and 0.08 percent, respectively.<br />
The other elements that occurred as major elements in the VHNM<br />
samples were AI, Ca, Ba, and Mg. Aluminum occurred in the<br />
range of about 0.3 to 6.5 percent. Calcium had a concentration<br />
range of 0.2 to 2.5 percent in 11 of the 14 samples. Concentrations<br />
of barium varied widely, and it appeared as a major. minor, or<br />
trace element in the various VHNM samples. Although Mg was<br />
present in the VHNM samples. accurate amounts could not be<br />
determined because it was discovered after the analyses that the<br />
Mg standard had chemically decomposed; hence Mg values are<br />
not reported.<br />
Vanadium occurred as a trace element in the VHNM samples,<br />
with concentrations ranging from 50 to 655 ppm. Uranium and<br />
Th were also present in the samples as trace elements with maximum<br />
OREGON GEOLOGY, VOLUME 51, NUMBER 6, NOVEMBER 1989 131