Ore Bin / Oregon Geology magazine / journal - Oregon Department ...
Ore Bin / Oregon Geology magazine / journal - Oregon Department ...
Ore Bin / Oregon Geology magazine / journal - Oregon Department ...

You also want an ePaper? Increase the reach of your titles
YUMPU automatically turns print PDFs into web optimized ePapers that Google loves.
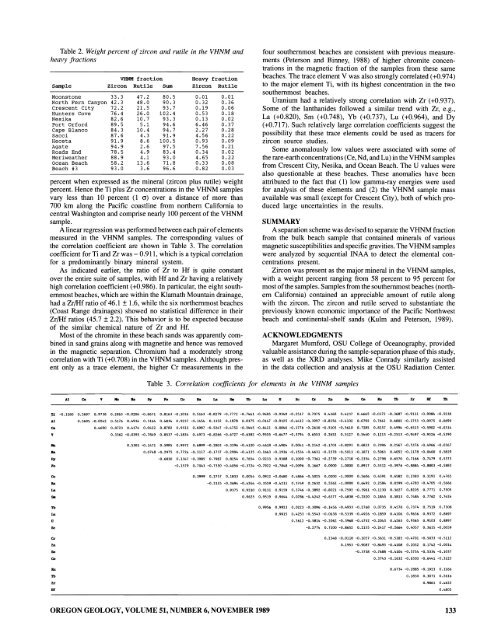
Table 2. Weight percent of zircon and rutile in the VHNM and<br />
heavy fractions<br />
VHNM fraction Heavy fraction<br />
Sample Zircon Rutile Swn Zircon Rutile<br />
Moonstone 33.3 47.2 BO.5 0.01 0.01<br />
North Fern Canyon 42.3 4B.0 90.3 0.32 0.36<br />
Crescent City 72.2 21.5 93.7 0.19 0.06<br />
Hunters Cove 76.4 26.0 102.4 0.53 0.18<br />
Nesika 82.6 10.7 93.3 0.13 0.02<br />
Port Orford 89.5 5.1 94.6 6.46 0.37<br />
Cape Blanco 84.3 10.4 94.7 2.27 0.28<br />
Sacci 87.6 4.3 91.9 4.56 0.22<br />
Heceta 91.9 8.6 100.5 0.93 0.09<br />
Agate 94.9 2.6 97.5 7.56 0.21<br />
Roads End 78.5 4.9 83.4 0.34 0.02<br />
Meriweather 88.9 4.1 93.0 4.65 0.22<br />
Ocean Beach 58.2 13.6 71.8 0.33 0.08<br />
Beach #3 93.0 3.6 96.6 0.82 0.03<br />
percent when expressed as the mineral (zircon plus rutile) weight<br />
percent. Hence the Ti plus Zr concentrations in the VHNM samples<br />
vary less than 10 percent (l a) over a distance of more than<br />
700 km along the Pacific coastline from northern California to<br />
central Washington and comprise nearly 100 percent of the VHNM<br />
sample.<br />
A linear regression was performed between each pair of elements<br />
measured in the VHNM samples. The corresponding values of<br />
the correlation coefficient are shown in Table 3. The correlation<br />
coefficient for Ti and Zr was - 0.911, which is a typical correlation<br />
for a predominantly binary mineral system.<br />
As indicated earlier, the ratio of Zr to Hf is quite constant<br />
over the entire suite of samples, with Hf and Zr having a relatively<br />
high correlation coefficient (+0.986). In particular, the eight southernmost<br />
beaches, which are within the Klamath Mountain drainage,<br />
had a Zr/Hf ratio of 46.1 ± 1.6, while the six northernmost beaches<br />
(Coast Range drainages) showed no statistical difference in their<br />
Zr/Hf ratios (45.7 ± 2.2). This behavior is to be expected because<br />
of the similar chemical nature of Zr and Hf.<br />
Most of the chromite in these beach sands was apparently combined<br />
in sand grains along with magnetite and hence was removed<br />
in the magnetic separation. Chromium had a moderately strong<br />
correlation with Ti (+0.708) in the VHNM samples. Although present<br />
only as a trace element, the higher Cr measurements in the<br />
AI ... Ie Co Ba ..<br />
.. !b<br />
Table 3. Correlation coefficients for elements in the VHNM samples<br />
four southernmost beaches are consistent with previous measurements<br />
(Peterson and <strong>Bin</strong>ney, 1988) of higher chromite concentrations<br />
in the magnetic fraction of the samples from these same<br />
beaches. The trace element V was also strongly correlated (+0.974)<br />
to the major element Ti, with its highest concentration in the two<br />
southernmost beaches.<br />
Uranium had a relatively strong correlation with Zr (+0.937).<br />
Some of the lanthanides followed a similar trend with Zr, e.g.,<br />
La (+0.820), Sm (+0.748), Yb (+0.737), Lu (+0.964), and Dy<br />
(+0.717). Such relatively large correlation coefficients suggest the<br />
possibility that these trace elements could be used as tracers for<br />
zircon source studies.<br />
Some anomalously low values were associated with some of<br />
the rare-earth concentrations (Ce, Nd, and Lu) in the VHNM samples<br />
from Crescent City, Nesika, and Ocean Beach. The U values were<br />
also questionable at these beaches. These anomalies have been<br />
attributed to the fact that (1) low gamma-ray energies were used<br />
for analysis of these elements and (2) the VHNM sample mass<br />
available was small (except for Crescent City), both of which produced<br />
large uncertainties in the results.<br />
SUMMARY<br />
A separation scheme was devised to separate the VHNM fraction<br />
from the bulk beach sample that contained minerals of various<br />
magnetic susceptibilities and specific gravities. The VHNM samples<br />
were analyzed by sequential INAA to detect the elemental concentrations<br />
present.<br />
Zircon was present as the major mineral in the VHNM samples,<br />
with a weight percent ranging from 58 percent to 95 percent for<br />
most of the samples. Samples from the southernmost beaches (northern<br />
California) contained an appreciable amount of rutile along<br />
with the zircon. The zircon and rutile served to substantiate the<br />
previously known economic importance of the Pacific Northwest<br />
beach and continental-shelf sands (Kulm and Peterson, 1989).<br />
ACKNOWLEDGMENTS<br />
Margaret Mumford, OSU College of Oceanography, provided<br />
valuable assistance during the sample-separation phase of this study,<br />
as well as the XRD analyses. Mike Conrady similarly assisted<br />
in the data collection and analysis at the OSU Radiation Center.<br />
lou u Sc Cr ... Sa Zr IIf<br />
;rt -0.1580 0,3697 0.9738 0.2863 -0.0206 -0.8671 0.8163 -0.1016 0.5163 -0.8279 -0.7772 -0.7461 -0.9485 -0.9349 -0.2517 0.7075 0.4168 0.4237 0.4665 -0.0172 -0.3687 -0.9111 -0.9084 -0.5238<br />
AI 0.5695 -0.0242 0.5176 0.,.,934 0.3164 0.4834 0.9237 -0.1454 0.1152 0.1878 0.0375 -0.0147 -0.9325 -0.4412 -0.3997 -0.8156 -0.4102 0.0792 0.7661 0.6802 -0.1753 -0.0975 0.0699<br />
ca 0.4690 0.8723 0.4374 0.0422 0.8782 0.9312 0.6987 -0.5247 -0.4752 -0.5445 -0.6421 0.0040 -0.1776 -0.2630 -0.5105 -0.5610 0.7285 0.8157 0.4994 -0.6513 -0.5902 -0.0314<br />
...<br />
Ie<br />
By<br />
Fe<br />
Co<br />
Ba<br />
..<br />
!b<br />
...<br />
u<br />
Sc<br />
Cr<br />
...<br />
Sa<br />
Ce<br />
...<br />
!b<br />
Zr<br />
IIf<br />
0.3362 -0.0395 -0.7849 0.8537 -0.1834 0.4973 -0.8266 -0.6727 -0.6382 -0.9555 -0.6477 -0.3794 0.6553 0.2652 0.5127 0.5440 0.1213 -0.2513 -0.9497 -0.9326 -0.5190<br />
0.5305 -0.1471 0.5985 0.9972 0.6899 -0.2803 -0.3396 -0.4120 -0.4618 -0.4904 0.0041 -0.2142 -0.1701 -0.8291 0.6813 0.7096 0.2567 -0.5376 -0.4966 -0.0367<br />
0.0748 -0.2975 0.7724 -0.3117 -0.1737 -0.2904 -0.4135 -0.1663 -0.1936 -0.1534 -0.4631 -0.2378 -0.5013 -0.1871 0.5063 0.4052 -0.1178 -0.0400 0.5829<br />
-0.6830 0.1347 -0.3985 0.7987 0.8254 0.7654 0.9233 0.9388 0.1090 -0.7361 -0.2739 -0.2718 -0.2354 0.2798 0.6570 0.7166 0.7479 0.5373<br />
-0.1579 0.7043 -0.7350 -0.4056 -0.3724 -0.7922 -0.7848 -0.0096 0.1667 0.0000 1.0000 0.8917 0.5312 -0.3976 -0.8884 -0.8803 -0.5883<br />
0.3999 0.2757 0.1833 0.0054 0.0912 -0.0480 0.4866 -0.5025 0.0000 -1.0000 0.5606 0.4591 0.6582 0.2383 0.3191 0.4765<br />
-0.2115 -0.3694 -0.4264 -0.3559 -0.4211 0.3749 0.2632 0.5562 -1.0000 0.6492 0.2584 0.0299 -0.4783 -0.4705 -0.5666<br />
0.9375 0.9210 0.9131 0.9159 0.3746 -0.3892 -0.8021 -0.7592 -0.3961 -0.1230 0.3627 0.8205 0.7771 0.7505<br />
0.9625 0.9519 0.9644 0.0786 -0.4242 -0.6377 -0.4838 -0.2520 0.1845 0.5813 0.7484 0.7762 0.7424<br />
0.9956 0.9923 0.0223 -0.3096 -0.1456 -0.4933 -0.2768 0.0735 0.4578 0.7374 0.7519 0.7308<br />
0.9915 0.4253 -0.5543 -0.0638 -0.5339 -0.4926 -0.1859 0.4106 0.9636 0.9372 0.8697<br />
0.3612 -0.5814 -0.2062 -0.3968 -0.4752 -0.2043 0.4265 0.9365 0.9103 0.8897<br />
-0.2774 0.7100 -0.8652 0.2155 -0.2417 -0.2664 0.4057 0.3615 -0.0059<br />
0.2349 -0.0110 -0.1057 -0.3631 -0.5185 -0.4701 -0.5033 -0.5112<br />
0.1953 -0.9087 -0.8493 -0.4108 0.2032 0.1742 -0.0014<br />
-0.3758 -0.7688 -0.4104 -0.5754 -0.5334 -0.1037<br />
0.3743 -0.1632 -0.6503 -0.6441 -0.3123<br />
0.6734 -0.2885 -0.1923 0.1266<br />
0.1830 0.3071 0.2616<br />
0.9861 0.4622<br />
0.4902<br />
OREGON GEOLOGY, VOLUME 51, NUMBER 6, NOVEMBER 1989 133