Gonzalo C. Caprirolo and Marko Glažar Fiscal multipliers ... - UMAR
Gonzalo C. Caprirolo and Marko Glažar Fiscal multipliers ... - UMAR
Gonzalo C. Caprirolo and Marko Glažar Fiscal multipliers ... - UMAR

You also want an ePaper? Increase the reach of your titles
YUMPU automatically turns print PDFs into web optimized ePapers that Google loves.
Working Paper 2/2013<br />
<strong>Fiscal</strong> <strong>multipliers</strong> <strong>and</strong> policy mix during fiscal consolidation process: minimizing the impact<br />
of fiscal adjustment on economic activity (GDP)<br />
4<br />
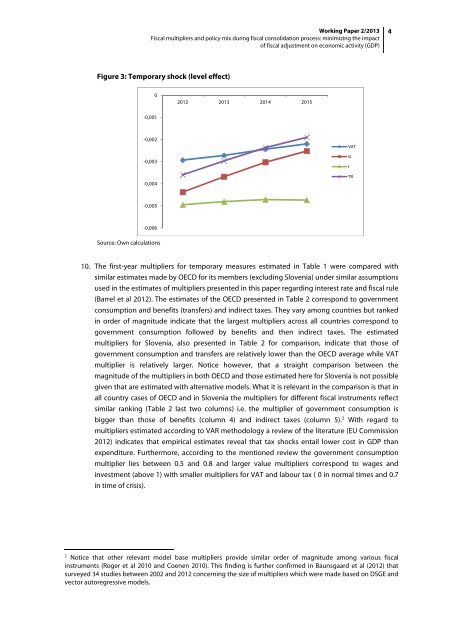
Figure 3: Temporary shock (level effect)<br />
0<br />
2012 2013 2014 2015<br />
-0,001<br />
-0,002<br />
-0,003<br />
-0,004<br />
VAT<br />
G<br />
I<br />
TR<br />
-0,005<br />
-0,006<br />
Source: Own calculations<br />
10. The first-year <strong>multipliers</strong> for temporary measures estimated in Table 1 were compared with<br />
similar estimates made by OECD for its members (excluding Slovenia) under similar assumptions<br />
used in the estimates of <strong>multipliers</strong> presented in this paper regarding interest rate <strong>and</strong> fiscal rule<br />
(Barrel et al 2012). The estimates of the OECD presented in Table 2 correspond to government<br />
consumption <strong>and</strong> benefits (transfers) <strong>and</strong> indirect taxes. They vary among countries but ranked<br />
in order of magnitude indicate that the largest <strong>multipliers</strong> across all countries correspond to<br />
government consumption followed by benefits <strong>and</strong> then indirect taxes. The estimated<br />
<strong>multipliers</strong> for Slovenia, also presented in Table 2 for comparison, indicate that those of<br />
government consumption <strong>and</strong> transfers are relatively lower than the OECD average while VAT<br />
multiplier is relatively larger. Notice however, that a straight comparison between the<br />
magnitude of the <strong>multipliers</strong> in both OECD <strong>and</strong> those estimated here for Slovenia is not possible<br />
given that are estimated with alternative models. What it is relevant in the comparison is that in<br />
all country cases of OECD <strong>and</strong> in Slovenia the <strong>multipliers</strong> for different fiscal instruments reflect<br />
similar ranking (Table 2 last two columns) i.e. the multiplier of government consumption is<br />
bigger than those of benefits (column 4) <strong>and</strong> indirect taxes (column 5). 2 With regard to<br />
<strong>multipliers</strong> estimated according to VAR methodology a review of the literature (EU Commission<br />
2012) indicates that empirical estimates reveal that tax shocks entail lower cost in GDP than<br />
expenditure. Furthermore, according to the mentioned review the government consumption<br />
multiplier lies between 0.5 <strong>and</strong> 0.8 <strong>and</strong> larger value <strong>multipliers</strong> correspond to wages <strong>and</strong><br />
investment (above 1) with smaller <strong>multipliers</strong> for VAT <strong>and</strong> labour tax ( 0 in normal times <strong>and</strong> 0.7<br />
in time of crisis).<br />
2<br />
Notice that other relevant model base <strong>multipliers</strong> provide similar order of magnitude among various fiscal<br />
instruments (Roger et al 2010 <strong>and</strong> Coenen 2010). This finding is further confirmed in Baunsgaard et al (2012) that<br />
surveyed 34 studies between 2002 <strong>and</strong> 2012 concerning the size of <strong>multipliers</strong> which were made based on DSGE <strong>and</strong><br />
vector autoregressive models.