Gonzalo C. Caprirolo and Marko Glažar Fiscal multipliers ... - UMAR
Gonzalo C. Caprirolo and Marko Glažar Fiscal multipliers ... - UMAR
Gonzalo C. Caprirolo and Marko Glažar Fiscal multipliers ... - UMAR

You also want an ePaper? Increase the reach of your titles
YUMPU automatically turns print PDFs into web optimized ePapers that Google loves.
Working Paper 2/2013<br />
<strong>Fiscal</strong> <strong>multipliers</strong> <strong>and</strong> policy mix during fiscal consolidation process: minimizing the impact<br />
of fiscal adjustment on economic activity (GDP)<br />
14<br />
APPENDIX: IMPULSE RESPONSE TO PERMANENT SHOCKS<br />
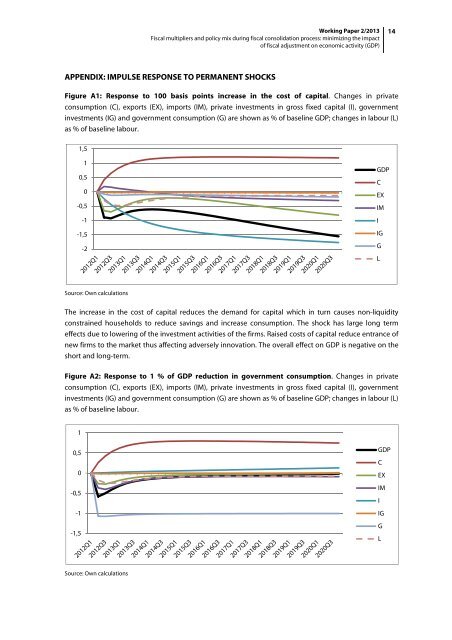
Figure A1: Response to 100 basis points increase in the cost of capital. Changes in private<br />
consumption (C), exports (EX), imports (IM), private investments in gross fixed capital (I), government<br />
investments (IG) <strong>and</strong> government consumption (G) are shown as % of baseline GDP; changes in labour (L)<br />
as % of baseline labour.<br />
1,5<br />
1<br />
0,5<br />
0<br />
-0,5<br />
-1<br />
-1,5<br />
-2<br />
GDP<br />
C<br />
EX<br />
IM<br />
I<br />
IG<br />
G<br />
L<br />
Source: Own calculations<br />
The increase in the cost of capital reduces the dem<strong>and</strong> for capital which in turn causes non-liquidity<br />
constrained households to reduce savings <strong>and</strong> increase consumption. The shock has large long term<br />
effects due to lowering of the investment activities of the firms. Raised costs of capital reduce entrance of<br />
new firms to the market thus affecting adversely innovation. The overall effect on GDP is negative on the<br />
short <strong>and</strong> long-term.<br />
Figure A2: Response to 1 % of GDP reduction in government consumption. Changes in private<br />
consumption (C), exports (EX), imports (IM), private investments in gross fixed capital (I), government<br />
investments (IG) <strong>and</strong> government consumption (G) are shown as % of baseline GDP; changes in labour (L)<br />
as % of baseline labour.<br />
1<br />
0,5<br />
0<br />
-0,5<br />
-1<br />
-1,5<br />
GDP<br />
C<br />
EX<br />
IM<br />
I<br />
IG<br />
G<br />
L<br />
Source: Own calculations