Gonzalo C. Caprirolo and Marko Glažar Fiscal multipliers ... - UMAR
Gonzalo C. Caprirolo and Marko Glažar Fiscal multipliers ... - UMAR
Gonzalo C. Caprirolo and Marko Glažar Fiscal multipliers ... - UMAR

You also want an ePaper? Increase the reach of your titles
YUMPU automatically turns print PDFs into web optimized ePapers that Google loves.
Working Paper 2/2013<br />
<strong>Fiscal</strong> <strong>multipliers</strong> <strong>and</strong> policy mix during fiscal consolidation process: minimizing the impact<br />
of fiscal adjustment on economic activity (GDP)<br />
12<br />
Table 5: <strong>Fiscal</strong> consolidation policy mix envisaged in the Stability Program 2012<br />
Difference with respect to 2011 (% GDP)<br />
2012 2013 2014 2015<br />
Government consumption -0.9 -1.3 -1.1 -0.9<br />
of which wages -0.6 -0.9 -0.6 -0.4<br />
of which intermediate consumption -0.3 -0.4 -0.5 -0.6<br />
Transfers -0.3 -0.3 -0.1 0.2<br />
Gross fixed capital formation -0.2 -0.3 -0.3 -0.3<br />
Total expenditure -1.5 -1.9 -1.6 -1.1<br />
Source: SP 2012<br />
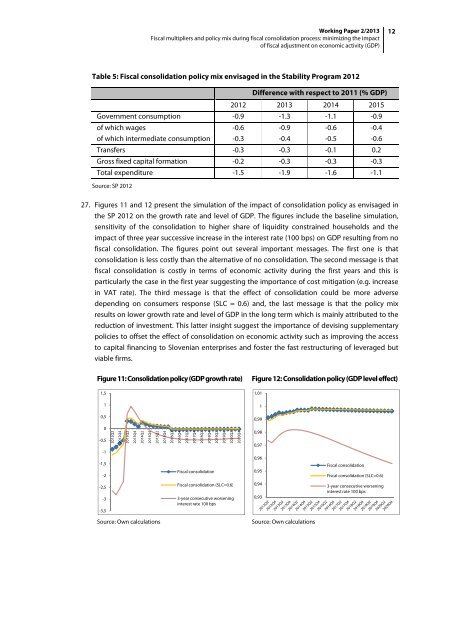
27. Figures 11 <strong>and</strong> 12 present the simulation of the impact of consolidation policy as envisaged in<br />
the SP 2012 on the growth rate <strong>and</strong> level of GDP. The figures include the baseline simulation,<br />
sensitivity of the consolidation to higher share of liquidity constrained households <strong>and</strong> the<br />
impact of three year successive increase in the interest rate (100 bps) on GDP resulting from no<br />
fiscal consolidation. The figures point out several important messages. The first one is that<br />
consolidation is less costly than the alternative of no consolidation. The second message is that<br />
fiscal consolidation is costly in terms of economic activity during the first years <strong>and</strong> this is<br />
particularly the case in the first year suggesting the importance of cost mitigation (e.g. increase<br />
in VAT rate). The third message is that the effect of consolidation could be more adverse<br />
depending on consumers response (SLC = 0.6) <strong>and</strong>, the last message is that the policy mix<br />
results on lower growth rate <strong>and</strong> level of GDP in the long term which is mainly attributed to the<br />
reduction of investment. This latter insight suggest the importance of devising supplementary<br />
policies to offset the effect of consolidation on economic activity such as improving the access<br />
to capital financing to Slovenian enterprises <strong>and</strong> foster the fast restructuring of leveraged but<br />
viable firms.<br />
Figure 11: Consolidation policy (GDP growth rate)<br />
1,5<br />
1<br />
0,5<br />
Figure 12: Consolidation policy (GDP level effect)<br />
1,01<br />
1<br />
0,99<br />
0<br />
-0,5<br />
2012Q2<br />
2012Q4<br />
2013Q2<br />
2013Q4<br />
2014Q2<br />
2014Q4<br />
2015Q2<br />
2015Q4<br />
2016Q2<br />
2016Q4<br />
2017Q2<br />
2017Q4<br />
2018Q2<br />
2018Q4<br />
2019Q2<br />
2019Q4<br />
2020Q2<br />
2020Q4<br />
0,98<br />
0,97<br />
-1<br />
-1,5<br />
-2<br />
<strong>Fiscal</strong> consolidation<br />
0,96<br />
0,95<br />
<strong>Fiscal</strong> consolidation<br />
<strong>Fiscal</strong> consolidation (SLC=0.6)<br />
-2,5<br />
-3<br />
-3,5<br />
<strong>Fiscal</strong> consolidation (SLC=0.6)<br />
3-year consecutive worsening<br />
interest rate 100 bps<br />
0,94<br />
0,93<br />
3-year consecutive worsening<br />
interest rate 100 bps<br />
Source: Own calculations<br />
Source: Own calculations