Carbon 2009 Emission trading coming home - UNEP Finance Initiative
Carbon 2009 Emission trading coming home - UNEP Finance Initiative
Carbon 2009 Emission trading coming home - UNEP Finance Initiative

Create successful ePaper yourself
Turn your PDF publications into a flip-book with our unique Google optimized e-Paper software.
<strong>Carbon</strong> <strong>2009</strong><br />
power and industry to decline by<br />
1.74 percent every year.<br />
Is the EU ETS now up to the<br />
task of delivering the long-term<br />
emission reduction needed? For<br />
the fourth year in a row, we have<br />
asked our survey respondents<br />
to evaluate the workings of the<br />
EU ETS. On four questions,<br />
respondents are asked to choose<br />
one alternative on a scale from<br />
1 (“completely disagree”) to 5<br />
(“completely agree”). We count<br />
options 4 and 5 as agreement.<br />
The result is given in Figure 2.6.<br />
Increased maturity<br />
of EU ETS?<br />
The results of the overall EU<br />
ETS evaluation among our<br />
respondents are relatively stable<br />
over time, with the exception<br />
of the question of whether the<br />
market is mature. Here we see<br />
a clear increase over time, from<br />
roughly 10 percent in 2006 and<br />
2007 to 18 percent last year and<br />
25 percent this year. Perhaps the<br />
transition from phase 1 to phase<br />
2, with its greater reduction<br />
requirement, has helped increase<br />
the perception of maturity in the<br />
market.<br />
At the same time, the statement<br />
that the “EU ETS is the most<br />
cost-efficient way to reduce<br />
emissions in the EU” has seen<br />
a steady, albeit slow, decline<br />
from 2006 to <strong>2009</strong>. The share of<br />
respondents agreeing (options 4<br />
or 5) with this statement is down<br />
from 47 percent in the first year<br />
it was asked, to 42 percent this<br />
year.<br />
More fundamentally than<br />
<strong>trading</strong>, the evaluation of the EU<br />
60%<br />
50%<br />
40%<br />
30%<br />
20%<br />
10%<br />
0%<br />
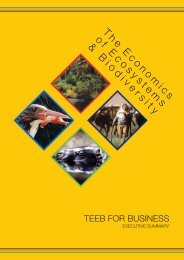
Figure 2.7: EU ETS and internal abatement<br />
Companies covered by EU ETS (<strong>2009</strong>) or CO2 regulation in general (2007);<br />
slightly different wording of questions in 2007. N=353 (<strong>2009</strong>).<br />
The EU ETS has not<br />
caused any<br />
emission reductions<br />
in our company<br />
Source: Point <strong>Carbon</strong><br />
The EU ETS has<br />
caused reductions<br />
to be planned but<br />
not yet started<br />
ETS must hinge on the degree<br />
to which it reduces emissions in<br />
the EU. Hence, we have sought<br />
to assess the degree of internal<br />
abatement in the EU ETS by<br />
asking companies directly about<br />
their own actions. Here, the<br />
results are almost unchanged<br />
from last year, with 46 percent<br />
of the respondents reporting<br />
abatement caused by the EU ETS<br />
(exactly the same number as last<br />
year), and three in ten reporting<br />
no emission reductions, see<br />
Figure 2.7.<br />
In sum, the surveys from 2007<br />
to <strong>2009</strong> indicate that just under<br />
two-thirds of companies in<br />
the EU ETS have reduced or<br />
started to plan reductions as a<br />
consequence of the EU ETS. The<br />
share is consolidating at this level,<br />
with exactly 62 percent reporting<br />
abatement or planned abatement<br />
in both 2008 and <strong>2009</strong>. Another<br />
The EU ETS has<br />
already caused<br />
emission reductions<br />
in my company<br />
2007<br />
2008<br />
<strong>2009</strong><br />
Don't know/<br />
not relevant (2007)<br />
question, of course, is the volume<br />
of these abatement efforts: Are<br />
they incremental improvements,<br />
do they represent a conversion<br />
to zero-carbon technology, or<br />
something in-between? Given<br />
that a majority of installations<br />
report emission reductions,<br />
while overall internal abatement<br />
in the EU ETS is relatively low,<br />
most installations have probably<br />
implemented incremental<br />
reductions rather than radical<br />
ones.<br />
Most installations<br />
implement incremental<br />
reductions<br />
The distribution of abatement<br />
action is fairly uniform across the<br />
main EU ETS sectors, as displayed<br />
in Figure 2.8. The highest degree<br />
of reported abatement is seen in<br />
8<br />
All rights reserved © <strong>2009</strong> Point <strong>Carbon</strong>