Topology, symmetry, and phase transitions in lattice gauge ... - tuprints
Topology, symmetry, and phase transitions in lattice gauge ... - tuprints
Topology, symmetry, and phase transitions in lattice gauge ... - tuprints

Create successful ePaper yourself
Turn your PDF publications into a flip-book with our unique Google optimized e-Paper software.
twist away from criticality 125<br />
3.5<br />
3<br />
2.5<br />
a˜σ/T<br />
2<br />
1.5<br />
1<br />
0.5<br />
10 20 30 40 50 60 70 80 90<br />
i<br />
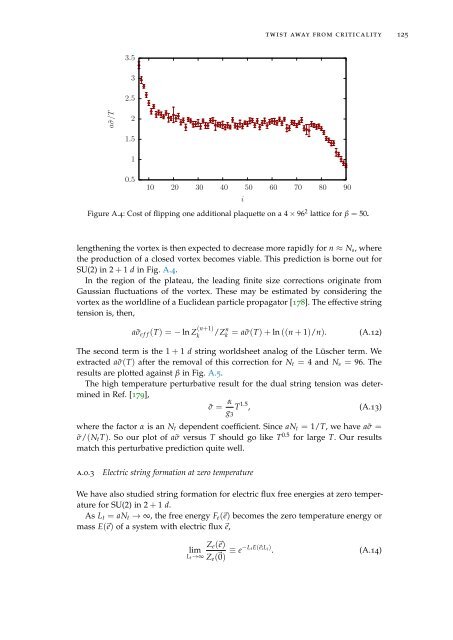
Figure A.4: Cost of flipp<strong>in</strong>g one additional plaquette on a 4 × 96 2 <strong>lattice</strong> for β = 50.<br />
lengthen<strong>in</strong>g the vortex is then expected to decrease more rapidly for n ≈ N s , where<br />
the production of a closed vortex becomes viable. This prediction is borne out for<br />
SU(2) <strong>in</strong> 2 + 1 d <strong>in</strong> Fig. A.4.<br />
In the region of the plateau, the lead<strong>in</strong>g f<strong>in</strong>ite size corrections orig<strong>in</strong>ate from<br />
Gaussian fluctuations of the vortex. These may be estimated by consider<strong>in</strong>g the<br />
vortex as the worldl<strong>in</strong>e of a Euclidean particle propagator [178]. The effective str<strong>in</strong>g<br />
tension is, then,<br />
a˜σ e f f (T) = − ln Z (n+1)<br />
k<br />
/Z n k<br />
= a˜σ(T) + ln ((n + 1)/n). (A.12)<br />
The second term is the 1 + 1 d str<strong>in</strong>g worldsheet analog of the Lüscher term. We<br />
extracted a˜σ(T) after the removal of this correction for N t = 4 <strong>and</strong> N s = 96. The<br />
results are plotted aga<strong>in</strong>st β <strong>in</strong> Fig. A.5.<br />
The high temperature perturbative result for the dual str<strong>in</strong>g tension was determ<strong>in</strong>ed<br />
<strong>in</strong> Ref. [179],<br />
˜σ = α g 3<br />
T 1.5 ,<br />
(A.13)<br />
where the factor α is an N t dependent coefficient. S<strong>in</strong>ce aN t = 1/T, we have a˜σ =<br />
˜σ/(N t T). So our plot of a˜σ versus T should go like T 0.5 for large T. Our results<br />
match this perturbative prediction quite well.<br />
a.0.3<br />
Electric str<strong>in</strong>g formation at zero temperature<br />
We have also studied str<strong>in</strong>g formation for electric flux free energies at zero temperature<br />
for SU(2) <strong>in</strong> 2 + 1 d.<br />
As L t = aN t → ∞, the free energy F e (⃗e) becomes the zero temperature energy or<br />
mass E(⃗e) of a system with electric flux ⃗e,<br />
Z e (⃗e)<br />
lim<br />
L t →∞ Z e (⃗0) ≡ e−L tE(⃗e;L i ) .<br />
(A.14)