

A framework for joint management of regional water-energy ... - Orbit
A framework for joint management of regional water-energy ... - Orbit
A framework for joint management of regional water-energy ... - Orbit

Create successful ePaper yourself
Turn your PDF publications into a flip-book with our unique Google optimized e-Paper software.
5 Results and Discussion<br />
The main findings <strong>of</strong> the study are summarized and discussed in this section.<br />
The first three sub-sections correspond to the work presented in the three scientific<br />
papers. Potential impacts <strong>of</strong> climate change on the Iberian power system<br />
are presented in Section 5.1; a method to improve the representation <strong>of</strong><br />
hydropower benefits is presented in Section 5.2; the influence <strong>of</strong> spatial aggregation<br />
on <strong>water</strong>-power analysis is shown in Section 5.3. The main limitations<br />
<strong>of</strong> the study are discussed in Section 5.4.<br />
5.1 Climate change impact on power system <strong>of</strong> the IP<br />
The goal was to assess some <strong>of</strong> the potential impacts <strong>of</strong> climate change on the<br />
Iberian power system under its current state. This was achieved by solving<br />
the optimization problem using a climate change scenario that contained data<br />
on potential future inflows, irrigation demands, and power demands. The expected<br />
change on these input series is shown in Figure 6.<br />
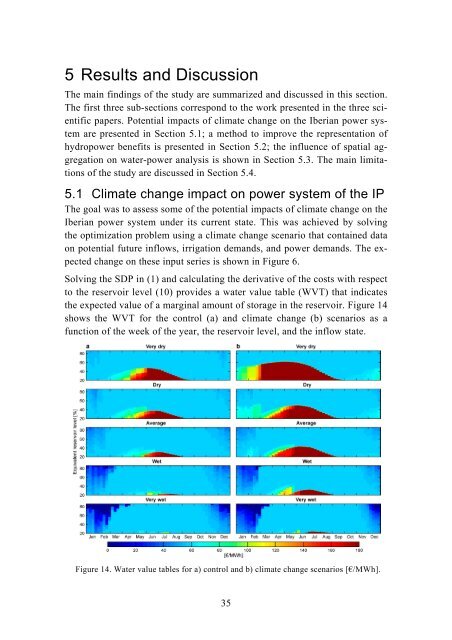
Solving the SDP in (1) and calculating the derivative <strong>of</strong> the costs with respect<br />
to the reservoir level (10) provides a <strong>water</strong> value table (WVT) that indicates<br />
the expected value <strong>of</strong> a marginal amount <strong>of</strong> storage in the reservoir. Figure 14<br />
shows the WVT <strong>for</strong> the control (a) and climate change (b) scenarios as a<br />
function <strong>of</strong> the week <strong>of</strong> the year, the reservoir level, and the inflow state.<br />
Figure 14. Water value tables <strong>for</strong> a) control and b) climate change scenarios [€/MWh].<br />
35


