Tracer Interpretation Using Temporal Moments on a Spreadsheet G
Tracer Interpretation Using Temporal Moments on a Spreadsheet G
Tracer Interpretation Using Temporal Moments on a Spreadsheet G

You also want an ePaper? Increase the reach of your titles
YUMPU automatically turns print PDFs into web optimized ePapers that Google loves.
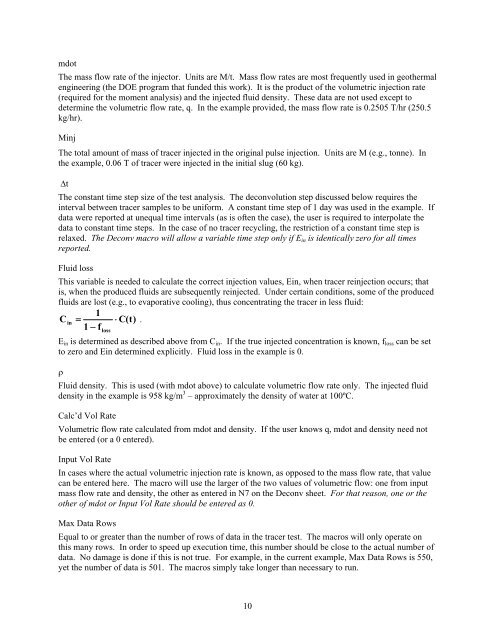
mdot<br />
The mass flow rate of the injector. Units are M/t. Mass flow rates are most frequently used in geothermal<br />
engineering (the DOE program that funded this work). It is the product of the volumetric injecti<strong>on</strong> rate<br />
(required for the moment analysis) and the injected fluid density. These data are not used except to<br />
determine the volumetric flow rate, q. In the example provided, the mass flow rate is 0.2505 T/hr (250.5<br />
kg/hr).<br />
Minj<br />
The total amount of mass of tracer injected in the original pulse injecti<strong>on</strong>. Units are M (e.g., t<strong>on</strong>ne). In<br />
the example, 0.06 T of tracer were injected in the initial slug (60 kg).<br />
t<br />
The c<strong>on</strong>stant time step size of the test analysis. The dec<strong>on</strong>voluti<strong>on</strong> step discussed below requires the<br />
interval between tracer samples to be uniform. A c<strong>on</strong>stant time step of 1 day was used in the example. If<br />
data were reported at unequal time intervals (as is often the case), the user is required to interpolate the<br />
data to c<strong>on</strong>stant time steps. In the case of no tracer recycling, the restricti<strong>on</strong> of a c<strong>on</strong>stant time step is<br />
relaxed. The Dec<strong>on</strong>v macro will allow a variable time step <strong>on</strong>ly if E in is identically zero for all times<br />
reported.<br />
Fluid loss<br />
This variable is needed to calculate the correct injecti<strong>on</strong> values, Ein, when tracer reinjecti<strong>on</strong> occurs; that<br />
is, when the produced fluids are subsequently reinjected. Under certain c<strong>on</strong>diti<strong>on</strong>s, some of the produced<br />
fluids are lost (e.g., to evaporative cooling), thus c<strong>on</strong>centrating the tracer in less fluid:<br />
1<br />
Cin<br />
C(t) .<br />
1 f<br />
loss<br />
E in is determined as described above from C in . If the true injected c<strong>on</strong>centrati<strong>on</strong> is known, f loss can be set<br />
to zero and Ein determined explicitly. Fluid loss in the example is 0.<br />
<br />
Fluid density. This is used (with mdot above) to calculate volumetric flow rate <strong>on</strong>ly. The injected fluid<br />
density in the example is 958 kg/m 3 – approximately the density of water at 100ºC.<br />
Calc’d Vol Rate<br />
Volumetric flow rate calculated from mdot and density. If the user knows q, mdot and density need not<br />
be entered (or a 0 entered).<br />
Input Vol Rate<br />
In cases where the actual volumetric injecti<strong>on</strong> rate is known, as opposed to the mass flow rate, that value<br />
can be entered here. The macro will use the larger of the two values of volumetric flow: <strong>on</strong>e from input<br />
mass flow rate and density, the other as entered in N7 <strong>on</strong> the Dec<strong>on</strong>v sheet. For that reas<strong>on</strong>, <strong>on</strong>e or the<br />
other of mdot or Input Vol Rate should be entered as 0.<br />
Max Data Rows<br />
Equal to or greater than the number of rows of data in the tracer test. The macros will <strong>on</strong>ly operate <strong>on</strong><br />
this many rows. In order to speed up executi<strong>on</strong> time, this number should be close to the actual number of<br />
data. No damage is d<strong>on</strong>e if this is not true. For example, in the current example, Max Data Rows is 550,<br />
yet the number of data is 501. The macros simply take l<strong>on</strong>ger than necessary to run.<br />
10