Tracer Interpretation Using Temporal Moments on a Spreadsheet G
Tracer Interpretation Using Temporal Moments on a Spreadsheet G
Tracer Interpretation Using Temporal Moments on a Spreadsheet G

You also want an ePaper? Increase the reach of your titles
YUMPU automatically turns print PDFs into web optimized ePapers that Google loves.
Volumetric Rate Used<br />
The greater of N6 and N7. This is the rate actually used in the macros.<br />
After these values are entered in the Dec<strong>on</strong>v sheet, reinjecti<strong>on</strong> effects are removed from the tracer<br />
output signal. This uses the c<strong>on</strong>voluti<strong>on</strong> integral discussed. As noted, if Ein is not identically zero for all<br />
time, the time step must be c<strong>on</strong>stant and equal to that given in cell N3. If that c<strong>on</strong>diti<strong>on</strong> is not satisfied,<br />
the macro reports a fatal error and stops. If Ein is zero, variable time steps are allowed.<br />
The dec<strong>on</strong>voluti<strong>on</strong> macro is invoked by typing (ctrl d) from anywhere in the Dec<strong>on</strong>v sheet, or by<br />
clicking <strong>on</strong> the butt<strong>on</strong> <strong>on</strong> the sheet. Column D is calculated as the corrected E(t) from Eapp and Ein.<br />
Columns A and D are then automatically copied to Columns A and B of the MoM sheet, and the two plot<br />
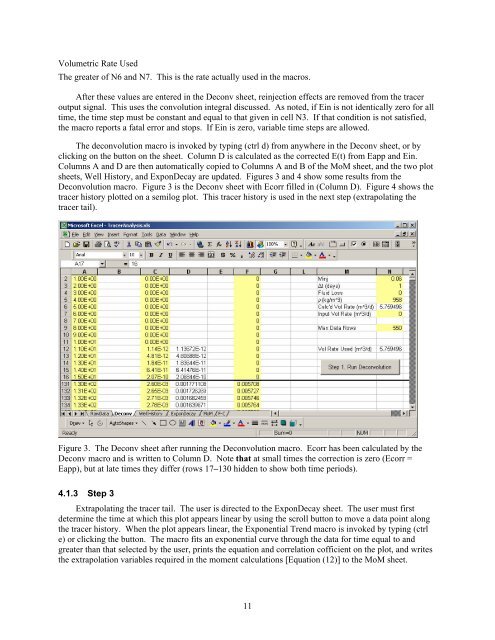
sheets, Well History, and Exp<strong>on</strong>Decay are updated. Figures 3 and 4 show some results from the<br />
Dec<strong>on</strong>voluti<strong>on</strong> macro. Figure 3 is the Dec<strong>on</strong>v sheet with Ecorr filled in (Column D). Figure 4 shows the<br />
tracer history plotted <strong>on</strong> a semilog plot. This tracer history is used in the next step (extrapolating the<br />
tracer tail).<br />
Figure 3. The Dec<strong>on</strong>v sheet after running the Dec<strong>on</strong>voluti<strong>on</strong> macro. Ecorr has been calculated by the<br />
Dec<strong>on</strong>v macro and is written to Column D. Note that at small times the correcti<strong>on</strong> is zero (Ecorr =<br />
Eapp), but at late times they differ (rows 17–130 hidden to show both time periods).<br />
4.1.3 Step 3<br />
Extrapolating the tracer tail. The user is directed to the Exp<strong>on</strong>Decay sheet. The user must first<br />
determine the time at which this plot appears linear by using the scroll butt<strong>on</strong> to move a data point al<strong>on</strong>g<br />
the tracer history. When the plot appears linear, the Exp<strong>on</strong>ential Trend macro is invoked by typing (ctrl<br />
e) or clicking the butt<strong>on</strong>. The macro fits an exp<strong>on</strong>ential curve through the data for time equal to and<br />
greater than that selected by the user, prints the equati<strong>on</strong> and correlati<strong>on</strong> cofficient <strong>on</strong> the plot, and writes<br />
the extrapolati<strong>on</strong> variables required in the moment calculati<strong>on</strong>s [Equati<strong>on</strong> (12)] to the MoM sheet.<br />
11