Tracer Interpretation Using Temporal Moments on a Spreadsheet G
Tracer Interpretation Using Temporal Moments on a Spreadsheet G
Tracer Interpretation Using Temporal Moments on a Spreadsheet G

Create successful ePaper yourself
Turn your PDF publications into a flip-book with our unique Google optimized e-Paper software.
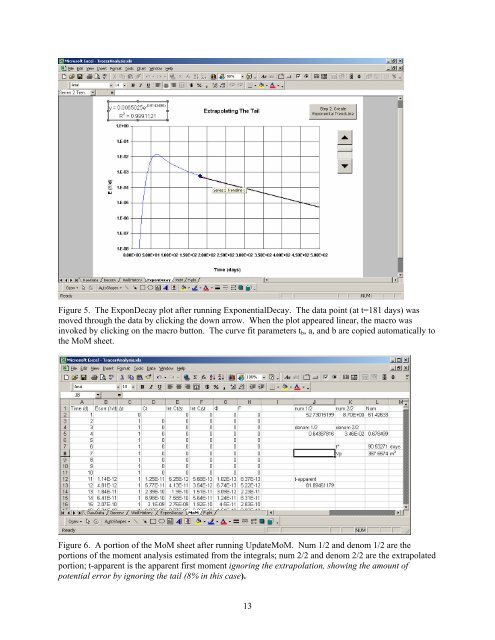
Figure 5. The Exp<strong>on</strong>Decay plot after running Exp<strong>on</strong>entialDecay. The data point (at t=181 days) was<br />
moved through the data by clicking the down arrow. When the plot appeared linear, the macro was<br />
invoked by clicking <strong>on</strong> the macro butt<strong>on</strong>. The curve fit parameters t b , a, and b are copied automatically to<br />
the MoM sheet.<br />
Figure 6. A porti<strong>on</strong> of the MoM sheet after running UpdateMoM. Num 1/2 and denom 1/2 are the<br />
porti<strong>on</strong>s of the moment analysis estimated from the integrals; num 2/2 and denom 2/2 are the extrapolated<br />
porti<strong>on</strong>; t-apparent is the apparent first moment ignoring the extrapolati<strong>on</strong>, showing the amount of<br />
potential error by ignoring the tail (8% in this case).<br />
13