Tracer Interpretation Using Temporal Moments on a Spreadsheet G
Tracer Interpretation Using Temporal Moments on a Spreadsheet G
Tracer Interpretation Using Temporal Moments on a Spreadsheet G

Create successful ePaper yourself
Turn your PDF publications into a flip-book with our unique Google optimized e-Paper software.
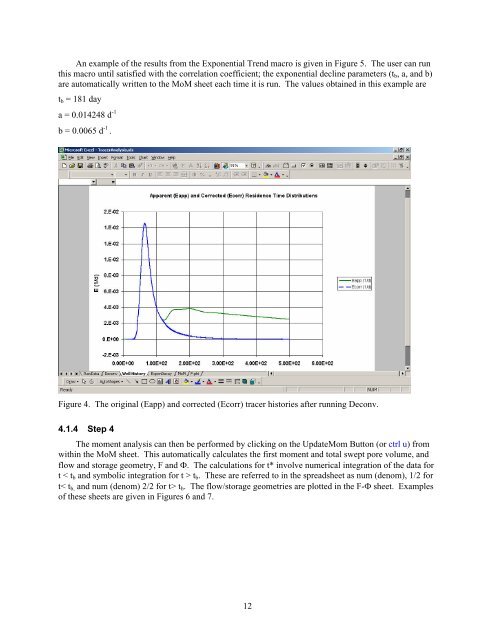
An example of the results from the Exp<strong>on</strong>ential Trend macro is given in Figure 5. The user can run<br />
this macro until satisfied with the correlati<strong>on</strong> coefficient; the exp<strong>on</strong>ential decline parameters (t b , a, and b)<br />
are automatically written to the MoM sheet each time it is run. The values obtained in this example are<br />
t b = 181 day<br />
a = 0.014248 d -1<br />
b = 0.0065 d -1 .<br />
Figure 4. The original (Eapp) and corrected (Ecorr) tracer histories after running Dec<strong>on</strong>v.<br />
4.1.4 Step 4<br />
The moment analysis can then be performed by clicking <strong>on</strong> the UpdateMom Butt<strong>on</strong> (or ctrl u) from<br />
within the MoM sheet. This automatically calculates the first moment and total swept pore volume, and<br />
flow and storage geometry, F and . The calculati<strong>on</strong>s for t* involve numerical integrati<strong>on</strong> of the data for<br />
t < t b and symbolic integrati<strong>on</strong> for t > t b . These are referred to in the spreadsheet as num (denom), 1/2 for<br />
t< t b, and num (denom) 2/2 for t> t b . The flow/storage geometries are plotted in the F- sheet. Examples<br />
of these sheets are given in Figures 6 and 7.<br />
12