How to investigate Adherence to Antiretroviral Treatment ... - INRUD
How to investigate Adherence to Antiretroviral Treatment ... - INRUD
How to investigate Adherence to Antiretroviral Treatment ... - INRUD

You also want an ePaper? Increase the reach of your titles
YUMPU automatically turns print PDFs into web optimized ePapers that Google loves.
Chapter 1. Overview of Manual<br />
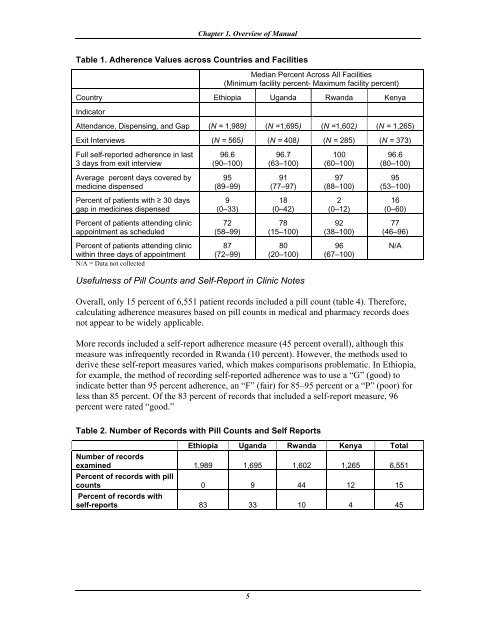
Table 1. <strong>Adherence</strong> Values across Countries and Facilities<br />
Median Percent Across All Facilities<br />
(Minimum facility percent- Maximum facility percent)<br />
Country Ethiopia Uganda Rwanda Kenya<br />
Indica<strong>to</strong>r<br />
Attendance, Dispensing, and Gap (N = 1,989) (N =1,695) (N =1,602) (N = 1,265)<br />
Exit Interviews (N = 565) (N = 408) (N = 285) (N = 373)<br />
Full self-reported adherence in last<br />
3 days from exit interview<br />
96.6<br />
(90–100)<br />
96.7<br />
(63–100)<br />
100<br />
(60–100)<br />
96.6<br />
(80–100)<br />
Average percent days covered by<br />
medicine dispensed<br />
95<br />
(89–99)<br />
91<br />
(77–97)<br />
97<br />
(88–100)<br />
95<br />
(53–100)<br />
Percent of patients with ≥ 30 days<br />
gap in medicines dispensed<br />
9<br />
(0–33)<br />
18<br />
(0–42)<br />
2<br />
(0–12)<br />
16<br />
(0–60)<br />
Percent of patients attending clinic<br />
appointment as scheduled<br />
72<br />
(58–99)<br />
78<br />
(15–100)<br />
92<br />
(38–100)<br />
77<br />
(46–96)<br />
Percent of patients attending clinic<br />
within three days of appointment<br />
N/A = Data not collected<br />
87<br />
(72–99)<br />
80<br />
(20–100)<br />
96<br />
(67–100)<br />
N/A<br />
Usefulness of Pill Counts and Self-Report in Clinic Notes<br />
Overall, only 15 percent of 6,551 patient records included a pill count (table 4). Therefore,<br />
calculating adherence measures based on pill counts in medical and pharmacy records does<br />
not appear <strong>to</strong> be widely applicable.<br />
More records included a self-report adherence measure (45 percent overall), although this<br />
measure was infrequently recorded in Rwanda (10 percent). <strong>How</strong>ever, the methods used <strong>to</strong><br />
derive these self-report measures varied, which makes comparisons problematic. In Ethiopia,<br />
for example, the method of recording self-reported adherence was <strong>to</strong> use a “G” (good) <strong>to</strong><br />
indicate better than 95 percent adherence, an “F” (fair) for 85–95 percent or a “P” (poor) for<br />
less than 85 percent. Of the 83 percent of records that included a self-report measure, 96<br />
percent were rated “good.”<br />
Table 2. Number of Records with Pill Counts and Self Reports<br />
Ethiopia Uganda Rwanda Kenya Total<br />
Number of records<br />
examined 1,989 1,695 1,602 1,265 6,551<br />
Percent of records with pill<br />
counts 0 9 44 12 15<br />
Percent of records with<br />
self-reports 83 33 10 4 45<br />
5