How to investigate Adherence to Antiretroviral Treatment ... - INRUD
How to investigate Adherence to Antiretroviral Treatment ... - INRUD
How to investigate Adherence to Antiretroviral Treatment ... - INRUD

Create successful ePaper yourself
Turn your PDF publications into a flip-book with our unique Google optimized e-Paper software.
Chapter 2. Core Indica<strong>to</strong>rs of <strong>Adherence</strong><br />
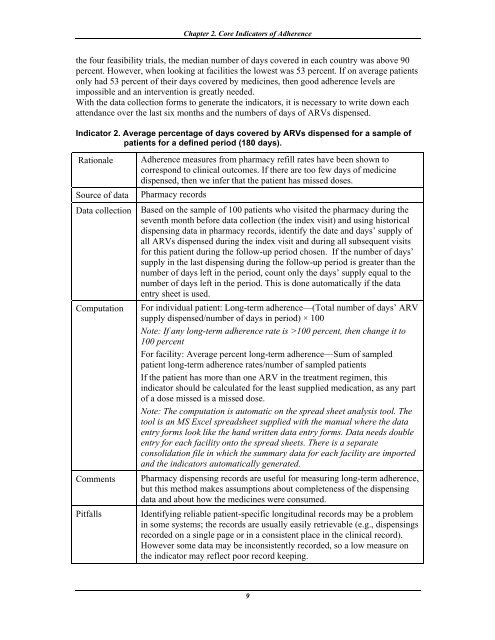
the four feasibility trials, the median number of days covered in each country was above 90<br />
percent. <strong>How</strong>ever, when looking at facilities the lowest was 53 percent. If on average patients<br />
only had 53 percent of their days covered by medicines, then good adherence levels are<br />
impossible and an intervention is greatly needed.<br />
With the data collection forms <strong>to</strong> generate the indica<strong>to</strong>rs, it is necessary <strong>to</strong> write down each<br />
attendance over the last six months and the numbers of days of ARVs dispensed.<br />
Indica<strong>to</strong>r 2. Average percentage of days covered by ARVs dispensed for a sample of<br />
patients for a defined period (180 days).<br />
Rationale<br />
Source of data<br />
Data collection<br />
Computation<br />
Comments<br />
Pitfalls<br />
<strong>Adherence</strong> measures from pharmacy refill rates have been shown <strong>to</strong><br />
correspond <strong>to</strong> clinical outcomes. If there are <strong>to</strong>o few days of medicine<br />
dispensed, then we infer that the patient has missed doses.<br />
Pharmacy records<br />
Based on the sample of 100 patients who visited the pharmacy during the<br />
seventh month before data collection (the index visit) and using his<strong>to</strong>rical<br />
dispensing data in pharmacy records, identify the date and days’ supply of<br />
all ARVs dispensed during the index visit and during all subsequent visits<br />
for this patient during the follow-up period chosen. If the number of days’<br />
supply in the last dispensing during the follow-up period is greater than the<br />
number of days left in the period, count only the days’ supply equal <strong>to</strong> the<br />
number of days left in the period. This is done au<strong>to</strong>matically if the data<br />
entry sheet is used.<br />
For individual patient: Long-term adherence—(Total number of days’ ARV<br />
supply dispensed/number of days in period) × 100<br />
Note: If any long-term adherence rate is >100 percent, then change it <strong>to</strong><br />
100 percent<br />
For facility: Average percent long-term adherence—Sum of sampled<br />
patient long-term adherence rates/number of sampled patients<br />
If the patient has more than one ARV in the treatment regimen, this<br />
indica<strong>to</strong>r should be calculated for the least supplied medication, as any part<br />
of a dose missed is a missed dose.<br />
Note: The computation is au<strong>to</strong>matic on the spread sheet analysis <strong>to</strong>ol. The<br />
<strong>to</strong>ol is an MS Excel spreadsheet supplied with the manual where the data<br />
entry forms look like the hand written data entry forms. Data needs double<br />
entry for each facility on<strong>to</strong> the spread sheets. There is a separate<br />
consolidation file in which the summary data for each facility are imported<br />
and the indica<strong>to</strong>rs au<strong>to</strong>matically generated.<br />
Pharmacy dispensing records are useful for measuring long-term adherence,<br />
but this method makes assumptions about completeness of the dispensing<br />
data and about how the medicines were consumed.<br />
Identifying reliable patient-specific longitudinal records may be a problem<br />
in some systems; the records are usually easily retrievable (e.g., dispensings<br />
recorded on a single page or in a consistent place in the clinical record).<br />
<strong>How</strong>ever some data may be inconsistently recorded, so a low measure on<br />
the indica<strong>to</strong>r may reflect poor record keeping.<br />
9