Fall - InsideOutdoor Magazine
Fall - InsideOutdoor Magazine
Fall - InsideOutdoor Magazine

Create successful ePaper yourself
Turn your PDF publications into a flip-book with our unique Google optimized e-Paper software.
• Management<br />
• Change in Control<br />
Data Points<br />
• Tax Impact<br />
• Performance Goals<br />
• Payment Schedule<br />
• Operational Integration<br />
show is stretching too far with the addition of ancillary<br />
companies and activities, consider this: outdoor participation<br />
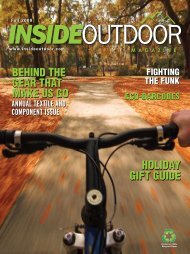
Would your buying patterns change<br />
for large rates were brands again that flat in you 2010 already for the third stock year in a row, show<br />
if they OIA decided figures. So to while start activities selling such direct as competitive racing<br />
to customers may be growing, on their it’s likely Web the site participants are coming from<br />
within the outdoor ranks. In other words, outside of some<br />
Yes, I would stop buying<br />
market share from that shift, Brand it’s going 11% to be hard for “core” brands to<br />
Yes, I would experience buy as little much as possible organic growth.<br />
from the brand<br />
19%<br />
Yes, I would reduce my buying<br />
Green from vs. that brand Greenbacks 34%<br />
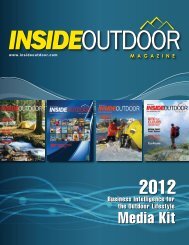
While 83 percent of global consumers say it is important<br />
No, I would not change my buying<br />
that companies from that implement brand 13%<br />
programs to improve the<br />
environment, less than a quarter say they will pay more for an<br />
I am not sure<br />
23%<br />
eco-friendly product, and willingness to pay more is lowest in<br />
Source: North Shopatron America, where only 12 percent say they will fork over<br />
extra greenbacks for green products, according to new figures<br />
from Nielsen. Among environmental and sustainability efforts<br />
manufacturers have taken, recycled packaging and energy<br />
efficient products are seen as the most broadly helpful.<br />
Belief in Sustainable Products Having Positive Impact<br />
Outdoor on Environment Participation, (% of 2006 Respondents; to 2010 Global Average)<br />
Total Outdoor Outings<br />
Product<br />
% of Respondents,<br />
Multiple OK<br />
11.6 Billion 11.4 Billion<br />
Energy efficient products 11.2 Billion or appliances 10.1 Billion 10.1 Billion83%<br />
Products Number in recyclable of Participants packaging 83%<br />
Products with little or no packaging 69%<br />
138.4 Billion<br />
Organic products 135.9 Billion<br />
134.4 Billion<br />
137.8 Billion 137.9 Billion<br />
64%<br />
Bought from farmer’s market 61%<br />
Participation Rate<br />
Ethically produced or grown 60%<br />
Not traveled long distance to store 60%<br />
49.1% Locally 50.0% made products 48.6% 48.9% 48.6% 59%<br />
Fair trade products 51%<br />
Products not tested on animals 44%<br />
Source: Nielsen<br />
2006 2007 2008 2009 2010<br />
Source: Tech-Enabled<br />
Outdoor Industry Association<br />
If your store isn’t empowering or planning to empower<br />
employees with technology, it’s likely falling behind. Though<br />
projects were postponed during the height of the recession,<br />
How long has your company been actively involved in<br />
adding technology-enabled touch-points for employees<br />
in your stores?<br />
Longer than 1 year<br />
Less than 1 year<br />
Budgeted project<br />
Project planned,<br />
not yet budgeted<br />
No plans<br />
Source: RSR Research<br />
8%<br />
3%<br />
8%<br />
14%<br />
8%<br />
5% 11%<br />
18%<br />
49%<br />
2011 2010<br />
70%<br />
Outdoor Participation, 2006 to 2010<br />
Total Outdoor Outings18000<br />
HIGH<br />
breathability<br />
11.6 Billion 11.4 Billion 16000<br />
11.2 Billion 10.1 Billion 10.1 Billion<br />
14000<br />
Number of Participants<br />
12000<br />
138.4 Billion<br />
137.8 Billion 137.9 Billion<br />
135.9 Billion<br />
134.4 Billion<br />
10000<br />
and economic prospects remain uncertain, retailers have<br />
gone forward Participation with technology Rate 8000deployment plans, suggest<br />
findings from Retail Systems 6000 Research. Indeed, “they<br />
recognize<br />
49.1%<br />
they<br />
50.0%<br />
have no<br />
48.6%<br />
real choice in the matter,” says RSR.<br />
4000 48.9% 48.6%<br />
LOW<br />
breathability<br />
Water Vapor Flux g/m 2 /24hrs<br />
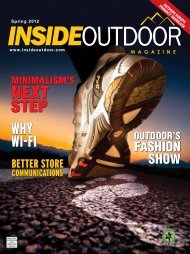
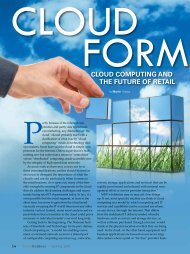
Print Still Pervasive, Persuasive<br />
0 25 50 75 100 125 150 175 200<br />
Even though 82 percent of Americans are online, 93<br />
Pressure Drop Across Sample (PA)<br />
percent 2006own mobile 2007 phones 2008 and 2009 155<br />
Forces<br />
million<br />
air 2010 through<br />
use<br />
fabric<br />
Facebook,<br />
to illustrate the effect of<br />
wind and movement on breathability<br />
printed Source: materials, Outdoor Industry either Association mailed or in No newspapers, air Slight air are still Increasing<br />
movement movement air movement<br />
the primary way folks learn about retailer sales information,<br />
show Nielsen findings. Source: Polartec The only electronic tactic that matches<br />
printed paper’s weekly reach is email. And when shoppers<br />
are asked what they want for the future, demand goes up<br />
for high How tech long information has your sources, company but been nearly actively 90 percent involved of in<br />
consumers adding still technology-enabled mostly want print, says touch-points Nielson. for employees<br />
in your stores?<br />
Weekly Usage of Retail Advertising Material<br />
Sales Longer Product than Information<br />
1 year<br />
Weekly Usage<br />
Newspaper 69% 49%<br />
Less than 1 year 8%<br />
Materials mailed to home 18% 67%<br />
Emails Budgeted from retailers project 3% 67%<br />
Social media 8% 2011 2010<br />
45%<br />
Smart or Project mobile planned, phone 14% 39%<br />
Printed not material yet budgeted in store 8% 38%<br />
Store site on computer No plans 5% 37%<br />
11%<br />
Store site using PC 35%<br />
In store kiosk 24%<br />
Source: RSR Research<br />
In store TV 21%<br />
Source: Nielsen<br />
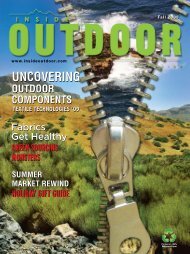
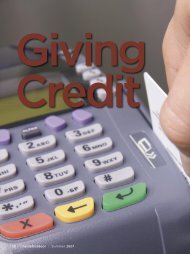
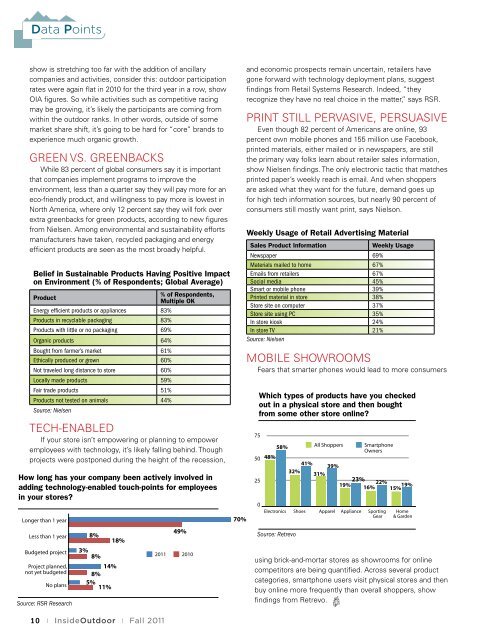
Mobile Showrooms<br />
Fears that smarter phones would lead to more consumers<br />
Which types of products have you checked<br />
out in a physical store and then bought<br />
from some other store online?<br />
75<br />
50<br />
25<br />
0<br />
48%<br />
58%<br />
Source: Retrevo<br />
All Shoppers<br />
41%<br />
39%<br />
32%<br />
31%<br />
Smartphone<br />
Owners<br />
19% 23% 16% 22% 15% 19%<br />
Electronics Shoes Apparel Appliance Sporting<br />
Gear<br />
Home<br />
& Garden<br />
using brick-and-mortar stores as showrooms for online<br />
competitors are being quantified. Across several product<br />
categories, smartphone users visit physical stores and then<br />
buy online more frequently than overall shoppers, show<br />
findings from Retrevo.<br />
70<br />
10 | <strong>InsideOutdoor</strong> | <strong>Fall</strong> 2011<br />
Privately Owned Retailers’ Inventories