Data Points Numbers worth noting by Martin Vilaboy Minimalist Mindshare Full three-quarters of “active Americans” are aware of the “barefoot” or minimalist concept for footwear design, according to a recent survey from Leisure Trends Group, and among those 75 percent of respondents who are aware, 46 percent say they have tried or are considering trying footwear in this category. However, when asked what activities they would consider for minimalist shoes, the panel of active Americans largely associated the movement with water sports rather than running. Perhaps some are confusing slipon water shoes for minimalist kicks. Activities Will Use “Barefoot”/Minimalist Footwear Kayaking 13% Canoeing 11% Beachwear 10% Other water sports 10% Boating 9% Runs of 2 miles or less 9% Casual wear 8% House shoes 7% Fishing 5% Runs longer than 5 miles 5% Yoga Structuring an Earnout 4% Aerobics 3% Other Issues for Consideration 3% None of the above 4% • Accounting • Earnout Amount Source: Leisure Trends Group • Availability of Capital • Earnout Period • Management Conflicting Reports • Performance Goals • Change in Control • Payment Schedule Some may say that channel conflict is simply a foregone • Tax Impact • Operational Integration conclusion of today’s retail environment, but that’s not to say retailers are happy about it. Almost two-thirds of retailers surveyed by Shopatron said they would reduce spending with brands that sell direct to consumers. That’s up from 51 percent Would your buying patterns change for large brands that you already stock if they decided to start selling direct to customers on their Web site who said the same thing in 2009, suggesting that retailers are not growing more comfortable with the practice as more and more manufacturers Structuring adopt the direct an strategy. EarnoutMore than one in 10 retailers said they Issues would for stop Consideration buying from the brand altogether. • Accounting • Earnout Amount QR • Code Availability of Readers Capital • Earnout Period Among • Management the 14 million mobile users in • the Performance U.S. who Goals have scanned a QR code with their smartphone, according to • Change in Control • Payment Schedule comScore counts, the most likely place the scanning took place was at • Tax home Impact in a printed magazine or newspaper. • Operational Nearly Integration half of respondents scanned a QR code from a printed publication, while product packaging was the second most common source. QR Code Source of Scanned QR Code Audience % of QR Code Would your buying patterns (000) change Audience Printed for magazine large or brands newspaper that you 7,138 already stock 49.4% Product if they packaging decided to start 5,101 selling direct 35.3% Website to customers on PC on their Web 3,957 site 27.4% Poster or flyer or kiosk 3,393 23.5% Yes, I would stop buying Business card or brochure from that Brand 1,94011% 13.4% Storefront Yes, I would buy as little as possible 1,850 12.8% TV from the brand 1,693 19% 11.7% Total audience Yes, I would reduce my buying 14,452 100% from that brand 34% Location When Scanning QR Code At home No, I would not change my buying from that brand 8,382 13% 58% Retail store 5,688 39.4% Grocery store I am not Polartec sure 3,546 NeoShell 23% Outperforms 24.5% in Dynamic At work 2,844 19.7% Source: Shopatron Outside or on public transit 1,827 18000 12.6% Restaurant 1,095 16000 7.6% Source: comScore MobiLens, June 2011 14000 12000 For those who complain that the 10000 Outdoor Retailer trade Outdoor Participation, 2006 8000 to 2010 Total Outdoor Outings 6000 11.6 Billion 11.4 Billion 11.2 Billion 4000 10.1 Billion 10.1 Billion HIGH breathability Going Inorganic LOW breathability Water Vapor Flux g/m 2 /24hrs Yes, I would stop buying from that Brand Yes, I would buy as little as possible from the brand Yes, I would reduce my buying from that brand No, I would not change my buying from that brand 11% 19% 13% 34% Number of Participants 0 25 50 75 100 125 150 175 2 Pressure Drop Across Sample (PA) 138.4 Billion 137.8 Billion 137.9 Forces Billion air through fabric to illustrate the effect o 135.9 Billion wind and movement on breathability 134.4 Billion Participation Rate Source: Polartec No air movement 49.1% 50.0% 48.6% 48.9% 48.6% Slight air movement Increasing air movement I am not sure 23% Source: Shopatron 8 | <strong>InsideOutdoor</strong> | <strong>Fall</strong> 2011 2006 2007 2008 2009 2010 Source: Outdoor Industry Association
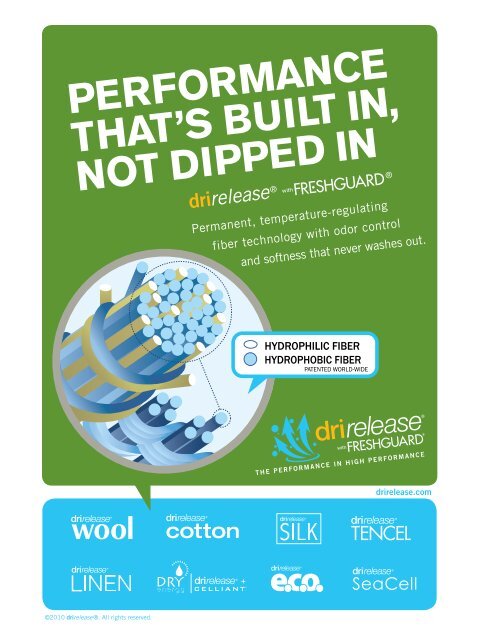
Permanent, temperature-regulating fiber technology with odor control and softness that never washes out.