

First Assessment Report - IPCC
First Assessment Report - IPCC
First Assessment Report - IPCC

Create successful ePaper yourself
Turn your PDF publications into a flip-book with our unique Google optimized e-Paper software.
2 Radiatn e Foi c mg of Climate 61<br />
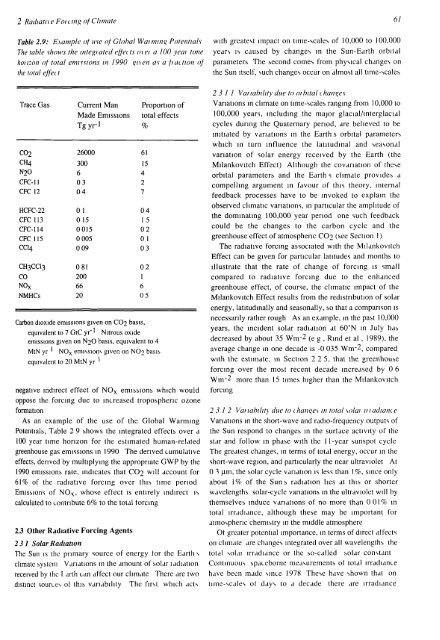
Table 2.9: Example of use of Global Waiminq Potentials<br />
The table shows the mtegiated effects o\ei a 100 yeai time<br />
hoiizon of total emissions in 1990 i>i\en as a fiaction of<br />
the total effec t<br />
Trace Gas<br />
co 2<br />
CH4<br />
N20<br />
CFC-11<br />
CFC 12<br />
HCFC-22<br />
CFC 113<br />
CFC-114<br />
CFC 115<br />
CCI4<br />
CH3CCI3<br />
CO<br />
NO x<br />
NMHCs<br />
Current Man<br />
Made Emissions<br />
Tgyr-1<br />
26000<br />
300<br />
6<br />
03<br />
04<br />
01<br />
0 15<br />
0015<br />
0 005<br />
0 09<br />
081<br />
200<br />
66<br />
20<br />
Proportion of<br />
total effects<br />
%<br />
61<br />
15<br />
4<br />
2<br />
7<br />
04<br />
15<br />
02<br />
01<br />
03<br />
02<br />
1<br />
6<br />
05<br />
Carbon dioxide emissions given on CO2 basis,<br />
equivalent to 7 GtC yr"' Nitrous oxide<br />
emissions given on N2O basis, equivalent to 4<br />
MtN yr ' NO x emissions given on NO2 basis<br />
equivalent to 20 MtN yr '<br />
negative indirect effect of NO x emissions which would<br />
oppose the forcing due to increased troposphenc oiont<br />
formation<br />
As an example of the use of the Global Warming<br />
Potentials, Table 2 9 shows the integrated effects over a<br />
100 year time horizon for the estimated human-related<br />
greenhouse gas emissions in 1990 The derived cumulative<br />
effects, derived by multiplying the appropriate GWP by the<br />
1990 emissions rate, indicates that CO2 will account for<br />
61% of the radiative forcing over this time period<br />
Emissions of NO x , whose effect is entirely indirect is<br />
calculated to contribute 6% to the total forcing<br />
2.3 Other Radiative Forcing Agents<br />
231 Solar Radiation<br />
The Sun is the primary source of energy tor the Earth s<br />
climate system Variations in the amount of solar iadiation<br />
received by the I arth can affect our climate There are two<br />
distinct sources of this variability The first which acts<br />
with greatest impact on time-scales of 10,000 to 100,000<br />
years is caused by changes in the Sun-Earth orbital<br />
parameters The second comes from physical changes on<br />
the Sun itself, such changes occur on almost all time-scales<br />
2 3 11 Vai /ability due to 01 bital chanqes<br />
Variations in climate on time-scales ranging from 10,000 to<br />
100,000 years, including the major glacial/interglacial<br />
cycles during the Quaternary period, are believed to be<br />
initiated by variations in the Earth s orbital parameters<br />
which in turn influence the latitudinal and seasonal<br />
variation of solar energy received by the Earth (the<br />
Milankovitch Effect) Although the covariation of these<br />
orbital parameters and the Earth s climate provides a<br />
compelling argument in favour of this theory, internal<br />
feedback processes have to be invoked to explain the<br />
observed climatic variations, in particular the amplitude of<br />
the dominating 100,000 year period one such feedback<br />
could be the changes to the carbon cycle and the<br />
greenhouse effect of atmospheric CO2 (see Section 1)<br />
The radiative forcing associated with the Milankovitch<br />
Effect can be given for particular latitudes and months to<br />
illustrate that the rate of change of forcing is small<br />
compared to radiative forcing due to the enhanced<br />
greenhouse effect, of course, the climatic impact of the<br />
Milankovitch Effect results from the redistribution of solar<br />
energy, latitudinally and seasonally, so that a comparison is<br />
necessarily rather rough As an example, in the past 10,000<br />
years, the incident solar radiation at 60°N in July has<br />
decreased by about 35 Wm-2 ( e g , Rind et al , 1989), the<br />
average change in one decade is -0 035 Wm-2, compared<br />
with the estimate, in Section 2 2 5, that the greenhouse<br />
forcing over the most recent decade increased by 0 6<br />
Wm-2 more than 15 times higher than the Milankovitch<br />
forcing<br />
2 3 12 Vai lability due to chaises in total sola/ madiance<br />
Variations in the short-wave and radio-frequency outputs of<br />
the Sun respond to changes in the surface activity of the<br />
star and follow in phase with the 11-year sunspot cycle<br />
The greatest changes, in terms of total energy, occur in the<br />
short-wave region, and particularly the near ultraviolet At<br />
0 3 u.m, the solar cycle variation is less than 1%, since only<br />
about 1% of the Suns radiation lies at this or shorter<br />
wavelengths solar-cycle variations in the ultraviolet will by<br />
themselves induce variations of no more than 0 01% in<br />
total irradiance, although these may be important for<br />
atmospheric chemistry in the middle atmosphere<br />
Of greater potential importance, in terms of direct affects<br />
on climate are changes integrated over all wavelengths the<br />
total solai irradiance or the so-called solar constant<br />
Continuous spaceborne measurements of total irradiance<br />
have been made since 197S These have shown that on<br />
time-scales of days to a decade there are irradiance


