

First Assessment Report - IPCC
First Assessment Report - IPCC
First Assessment Report - IPCC

You also want an ePaper? Increase the reach of your titles
YUMPU automatically turns print PDFs into web optimized ePapers that Google loves.
4 Validation of Climate Models 113<br />
cover in the Northern Hemisphere winter, with Southern<br />
Hemisphere snow confined mainly to Antarctica<br />
Detailed assessments of the simulations, especially for<br />
seasons other than winter, are hindered by the different<br />
forms of the model data (mostly seasonal mean liquid<br />
water content) and the observed data (either frequency of<br />
cover or maps of depth at ends of months) While all<br />
models capture the gross features of the seasonal cycle of<br />
snow cover, some models exhibit large errors Otherwise,<br />
except over eastern Asia where snow extents are mostly<br />
excessive (consistent with the low simulated temperatures<br />
(e g , Figure 4 9)), the models' average winter snow depths<br />
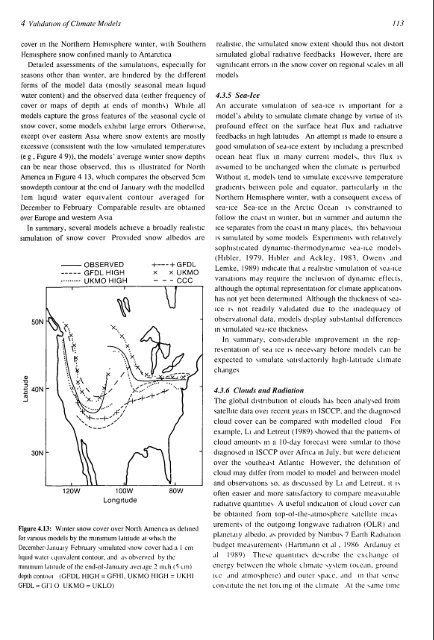
can be near those observed, this is illustrated for North<br />
America in Figure 4 13, which compares the observed 5cm<br />
snowdepth contour at the end ot January with the modelled<br />
lcm liquid water equivalent contour averaged for<br />
December to February Comparable results are obtained<br />
over Europe and western Asia<br />
In summary, several models achieve a broadly realistic<br />
simulation of snow cover Provided snow albedos are<br />
30N -<br />
120W<br />
OBSERVED<br />
GFDLHIGH<br />
UKMOHIGH<br />
100W<br />
Longitude<br />
+ + GFDL<br />
x x UKMO<br />
CCC<br />
80W<br />
Figure 4.13: Winter snow cover over North America as defined<br />
for various models by the minimum latitude at which the<br />
December-Janudiy February simulated snow cover had a I cm<br />
liquid walei equivalent contour, and as observed by the<br />
minimum latitude of the end-ot-January avciage 2 inch (S cm)<br />
depth contoui (GFDL HIGH = GFHI, UKMO HIGH = UKHI<br />
GFDL = GriO UKMO = UKLO)<br />
realistic, the simulated snow extent should thus not distort<br />
simulated global radiative feedbacks However, there are<br />
significant errors in the snow cover on regional scales in all<br />
models<br />
4.3.5 Sea-Ice<br />
An accurate simulation of sea-ice is important for a<br />
model's ability to simulate climate change by virtue of its<br />
profound effect on the surface heat flux and radiative<br />
feedbacks in high latitudes An attempt is made to ensure a<br />
good simulation of sea-ice extent by including a prescribed<br />
ocean heat flux in many current models, this flux is<br />
assumed to be unchanged when the climate is perturbed<br />
Without it, models tend to simulate excessive temperature<br />
gradients between pole and equator, particularly in the<br />
Northern Hemisphere winter, with a consequent excess of<br />
sea-ice Sea-ice in the Arctic Ocean is constrained to<br />
follow the coast in winter, but in summer and autumn the<br />
ice separates from the coast in many places, this behavioui<br />
is simulated by some models Experiments with relatively<br />
sophisticated dynamic-thermodynamic sea-ice models<br />
(Hibler, 1979, Hibler and Ackley, 1983, Owens and<br />
Lemke, 1989) indicate that a realistic simulation ot sea-ice<br />
variations may require the inclusion of dynamic effects,<br />
although the optimal representation for climate applications<br />
has not yet been determined Although the thickness of seaice<br />
is not readily validated due to the inadequacy of<br />
observational data, models display substantial differences<br />
in simulated sea-ice thickness<br />
In summary, considerable improvement in the representation<br />
of sea ice is necessary belore models can be<br />
expected to simulate satisfactorily high-latitude climate<br />
changes<br />
4.3.6 Clouds and Radiation<br />
The global distribution of clouds has been analysed lrom<br />
satellite data ovei recent yeais in ISCCP, and the diagnosed<br />
cloud cover can be compared with modelled cloud Foi<br />
example, Li and Letreut (1989) showed that the patterns of<br />
cloud amounts in a 10-day foiecast were similar to those<br />
diagnosed in ISCCP over Africa in July, but were deficient<br />
over the southeast Atlantic However, the definition of<br />
cloud may differ from model to model and between model<br />
and observations so, as discussed by Li and Letreut, it is<br />
often easier and more satisfactory to compare measuiable<br />
radiative quantities A useful indication of cloud cover can<br />
be obtained fiom top-of-the-atmospherc satellite meas<br />
urements of the outgoing longwave radiation (OLR) and<br />
planctaiy albedo, as provided by Nimbus 7 Earth Radiation<br />
budget measurements (Hartmann et al , 1986 Ardanuy ct<br />
al 1989) These quantities describe the exchange ol<br />
energy between the whole climate system (ocean, ground<br />
ice and atmosphcie) and outer space, and in that sense<br />
constitute the net toicine ol the climate At the same time


