

First Assessment Report - IPCC
First Assessment Report - IPCC
First Assessment Report - IPCC

Create successful ePaper yourself
Turn your PDF publications into a flip-book with our unique Google optimized e-Paper software.
Polit uuakei i Summaiy<br />
\\i\<br />
o<br />
04<br />
LU<br />
U<br />
Z<br />
<<br />
I<br />
o<br />
LU<br />
rr<br />
3<br />
h-<br />
<<br />
CL<br />
02<br />
00<br />
-0 2<br />
-0 4<br />
-0 6<br />
1870 1890 1910 1930<br />
YEAR<br />
Mh<br />
1950 1970 1990<br />
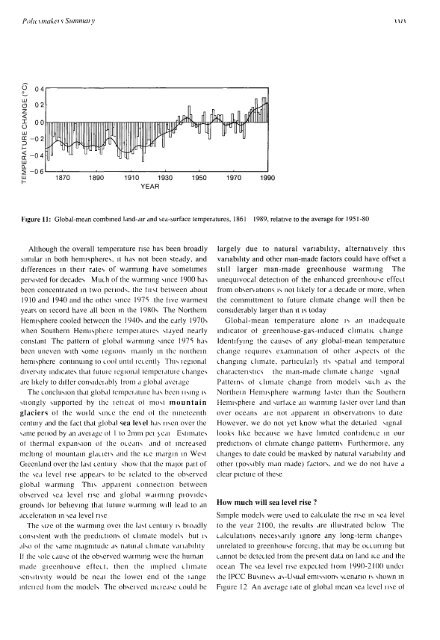
Figure 11: Global-mean combined land-air and sea-surface temperatures, 1861 1989, relative to the average for 1951-80<br />
Although the overall temperature rise has been broadly<br />
similar in both hemispheres, it has not been steady, and<br />
differences in their rates of warming have sometimes<br />
persisted for decades Much of the warming since 1900 has<br />
been concentrated in two penods, the fust between about<br />
1910 and 1940 and the othei since 1975 the five warmest<br />
years on iecord have all been in the 1980s The Northern<br />
Hemisphere cooled between the 1940s and the early 1970s<br />
when Southern Hemispheie tempeiatuies stayed nearly<br />
constant The pattern ol global warming since 1975 has<br />
been uneven with some legions mainly in the noithein<br />
hemisphere continuing to cool until iecentl) This icgional<br />
diversity indicates that lutuie icgional tempeiatuie changes<br />
arc likely to dillcr consideiabl) from a global aveiage<br />
The conclusion that global tempeiatuie has been using is<br />
stiongly supported by the ictieat ol most mountain<br />
glaciers ol the woild since the end ol the nineteenth<br />
centuiy and the fact that global sea level has nsen over the<br />
same penod by an aveiage ol I to 2mm pei \eai Estimates<br />
ol thermal expansion ol the oceans and of increased<br />
melting of mountain glacieis and the ice margin in West<br />
Gieenland over the last centuiy show that the ma]oi pait of<br />
the sea level rise appears to be ielatcd to the observed<br />
global warming This appaient connection between<br />
observed sea level rise and global wanning piovides<br />
grounds lor believing that lutuie warming will lead to an<br />
acceleration in sea level rise<br />
The size of the warming ovei the last centuiy is bioadly<br />
consistent with the piedictions ol climate models but is<br />
also ol the same magnitude as natuidl climate vailability<br />
II the sole cause ol the observed wanning weie the human<br />
made gieenhouse effect, then the implied climate<br />
sensitivity would be ncai the lowei end ol the uinge<br />
mleiicd liom the models The obscivcd inciedse could be<br />
largely due to natural variability, alternatively this<br />
variability and other man-made factors could have offset a<br />
still larger man-made greenhouse warming The<br />
unequivocal detection of the enhanced greenhouse effect<br />
from observations is not likely lor a decade or more, when<br />
the committment to future climate change will then be<br />
considerably larger than it is today<br />
Global-mean temperature alone is an inadequate<br />
indicator of greenhouse-gas-induced climatic change<br />
Identifying the causes of any global-mean temperatuie<br />
change lequires examination ot other aspects ol the<br />
changing climate, particulail} its spatial and temporal<br />
characteristics the man-made climate change signal<br />
Patterns of climate change from models such as the<br />
Northern Hemisphere warming lastei than the Southern<br />
Hemispheie and surlace an waiming laster over land than<br />
over oceans aie not apparent in observations to date<br />
However, we do not yet know what the detailed signal<br />
looks like because we have limited confidence in our<br />
predictions of climate change patterns Furthermoie, any<br />
changes to date could be masked by natural variability and<br />
other (possibly man made) factors, and we do not have a<br />
clear pictuie ot these<br />
How much will sea level rise ?<br />
Simple models were used to calculate the rise in sea level<br />
to the yedr 2100, the results dre lllustrdted below The<br />
calculations necessarily ignore dny long-term changes<br />
unrelated to greenhouse forcing, that may be occurnng but<br />
cannot be detected lrom the present data on land ice and the<br />
ocean The sea level rise expected liom 1990-2100 undci<br />
the <strong>IPCC</strong> Business as-Usual emissions scenario is shown in<br />
Figure 12 An average late of global mean sea level use ol


