

First Assessment Report - IPCC
First Assessment Report - IPCC
First Assessment Report - IPCC

Create successful ePaper yourself
Turn your PDF publications into a flip-book with our unique Google optimized e-Paper software.
7 Obsencd Climate Vernation and Change 221<br />
in the Noith Atlantic SST shown in Figure 7 H loi 1967-<br />
76 partly reflect this event<br />
Recently, Levitus (1989a, b, c d) has can led out a majoi<br />
study ol changes ol sub surlace temperature and salinity of<br />
the North Atlantic Ocean between 1955 59 and 1970 74<br />
1955-59 was near the end of a very warm period ol North<br />
Atlantic suiface waters, but by 1970-74 the subsequent<br />
cool period was well developed (Figure 7 13) Coolei water<br />
extended liom neai the sea surface to 1400m depth in the<br />
subtropical gyre O0-50°N) Beneath the subtropical gyre, a<br />
warming occurred between the two periods North ol this<br />
gyre there was an increase in the temperature and salinit)<br />
of the western sub aictic gyic The density changes<br />
associated with these changes in tempeiature and salinity<br />
indicate that the tiansport ol the Gull Stream may have<br />
decieased between the two periods Temperature difference<br />
lields along 24 5°N and ~\b 5°N piesented by Roemmich<br />
and Wunsch (1984) based on data gathered during 1981<br />
and the late 1950s, aie consistent with these ideas<br />
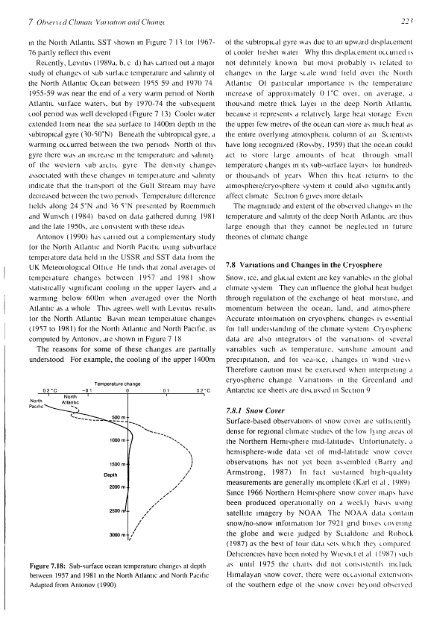
Antonov (1990) has earned out a complementary study<br />
lor the North Atlantic and North Pacilic using subsurface<br />
tempeiature data held in the USSR and SST data fiom the<br />
UK Meteoiological OH ice He finds that zonal aveiages of<br />
tempeiature changes between 1957 and 1981 show<br />
statistically significant cooling in the upper layers and a<br />
warming below 600m when averaged over the North<br />
Atlantic as a whole This agrees well with Levitus results<br />
for the North Atlantic Basin mean tempeiatuie changes<br />
(1957 to 1981) for the North Atlantic and North Pacific, as<br />
computed by Antonov, aie shown in Figure 7 18<br />
The reasons for some of these changes are partially<br />
understood For example, the cooling of the upper 1400m<br />
Temperature change<br />
02°C -01 0 01 02°C<br />
I North '<br />
1<br />
'<br />
rth Atlantic<br />
rfic~~—<br />
^-__~2><br />
-—-T^ •55^500 m-<br />
1000 m-<br />
1500 m-<br />
Depth<br />
\<br />
3000 m-<br />
i<br />
2000 m<br />
2500 J rrf-<br />
N^"»-<br />
/ \<br />
1<br />
Figure 7.18: Sub-surface ocean temperature changes at depth<br />
between 1957 and 1981 in the North Atlantic and North Pacific<br />
Adapted from Antonov (1990)<br />
/<br />
/'<br />
/<br />
ol the subtropical gyre was due to an upwaid displacement<br />
ol cooler lieshei watei Why this displacement occuned is<br />
not definitely known but most piobably is lclated to<br />
changes in the large scale wind held ovei the Noith<br />
Atlantic Ol paiticular importance is the temperatuie<br />
increase of approximately 0 1°C ovei, on average, a<br />
thousand metre thick layei in the deep North Atlantic<br />
because it represents a relativel} large heat storage Even<br />
the uppei few metres of the ocean can store as much heat as<br />
the entire overlying atmosphenc column ol an Scientists<br />
have long lecogm/ed (Rossby, 1959) that the ocean could<br />
act to store large amounts of heat thiough small<br />
temperature changes in its sub-surface layeis loi hundreds<br />
or thousands ot years When this heal ieturns to the<br />
atmospheie/cryosphere system it could also sigmticantlv<br />
affect climate Section 6 gives more details<br />
The magnitude and extent of the obseived changes in the<br />
temperature and salinity of the deep Noith Atlantic are thus<br />
large enough that they cannot be neglected in future<br />
theories of climate change<br />
7.8 Variations and Changes in the Cryosphere<br />
Snow, ice, and glacial extent aie key variables in the global<br />
climate system They can influence the global heat budget<br />
through regulation ot the exchange of heat moistuie, and<br />
momentum between the ocean, land, and atmosphere<br />
Accurate mloimation on cryosphenc changes is essential<br />
foi full undeistanding of the climate system Crjosphenc<br />
data are also integratois of the variations ol several<br />
variables such as temperatuie, sunshine amount and<br />
precipitation, and toi sea-ice, changes in wind stiess<br />
Therefore caution must be exercised when interpieting a<br />
cryosphenc change Variations in the Greenland and<br />
Antarctic ice sheets are discussed in Section 9<br />
7.8.1 Snow Cover<br />
Surface-based observations ol snow covei aie sulliuentlv,<br />
dense for regional climate studies of the low l>ing aieas of<br />
the Northern Hemispheie mid-latitudes Unfortunately, a<br />
hemisphere-wide data set of mid-latitude snow covei<br />
observations has not yet been assembled (Barry and<br />
Armstrong, 1987) In tact sustained high-quality<br />
measurements are generally incomplete (Karl et al , 1989)<br />
Since 1966 Northern Hemisphere snow cover maps have<br />
been produced operationally on a weekl> basis using<br />
satellite imagery by NOAA The NOAA data contain<br />
snow/no-snow infoimation lor 7921 grid boxes coveting<br />
the globe and weie judged by Scialdone and Robock<br />
(1987) as the best of four data sets which the} compared<br />
Deficiencies have been noted by Wiesnct et al (1987) such<br />
as until 1975 the chaits did not consistentlv include<br />
Himalayan snow cover, there were occasional extensions<br />
ol the southern edge ol the snow covei be>ond obseived


