- Page 7:
INTERGOVERNMENTAL PANEL ON CLIMATE
- Page 10 and 11:
Contents 9 Sea Level Rise 257 R.A.
- Page 13 and 14:
Foreword Many previous reports have
- Page 15:
Policymakers Summary Prepared by IP
- Page 19 and 20:
EXECUTIVE SUMMARY We are certain of
- Page 21:
Policymaket s Summary \m Introducti
- Page 24 and 25:
XVI Policymakei s Summaiy Table 1:
- Page 26 and 27:
\w// Policymakers Summaiy Table 2:
- Page 28 and 29:
Policymakers Summary 1120 560 280 1
- Page 30 and 31:
Wll predictions of climate change,
- Page 32 and 33:
XXIV Policymakers Summary ESTIMATES
- Page 34 and 35:
uw Polu \makei s Summai \ EQUILIBRI
- Page 36 and 37:
\X\lll Policymakeis Summaiy CONFIDE
- Page 38 and 39:
\w Policymakers Summaiy o, 120 LU S
- Page 40 and 41:
\\\ll Pohcymakeis Summaiy DEFORESTA
- Page 42 and 43:
\\\n Policymakeis Summaiy Annex EMI
- Page 45 and 46:
Intioduttion WWII Surface Pressure
- Page 47:
Inti oduttion sophisticated numeric
- Page 51 and 52:
CONTENTS Executive Summary 1.1 Intr
- Page 53 and 54:
EXECUTIVE SUMMARY The Earth's clima
- Page 55 and 56:
1 Gi eenhouse Gases and Aeiosols 7
- Page 57 and 58:
1 Gi eenhouse Gases and Aerosols 9
- Page 59 and 60:
7 Gi eenhouse Gases and Aei osoli 1
- Page 61:
1 Gi eenhouse Gast"; and Aei osols
- Page 64 and 65:
lb atmosphenc CO2 The climate chang
- Page 67 and 68:
1 G>eenhouse Gases and Aeiosols 19
- Page 69 and 70:
I Gi eenhouse Gases and Aei owls 21
- Page 71 and 72:
1 Gi eenhouse Gases and Aerosols 23
- Page 73 and 74:
Gi eenhouse Gases and Aei osols 25
- Page 75:
1 Gi eenhouse Gases and Aeiosoh 27
- Page 78 and 79:
w Gi eenhouse Gases and Aei osols 1
- Page 80 and 81:
32 Gi eenhouse Gases and Aei osols
- Page 82 and 83:
34 Gi eenhouse Gases and Aeiosols 1
- Page 84 and 85:
36 Gi eenhouse Gases and Act osols
- Page 86 and 87:
38 Gi eenhouse Gases and Aerosols 1
- Page 89:
2 Radiative Forcing of Climate K.P.
- Page 93 and 94:
EXECUTIVE SUMMARY 1 The climate of
- Page 95 and 96:
2 Radiali\ e Foicinq of Climate 47
- Page 97 and 98:
2 Radiative Foicing of Climate 49 a
- Page 99 and 100:
2 Radiative Fo>cim> of Climate 51 S
- Page 101 and 102:
2 Radiatn e Fo> c im> of Climate 53
- Page 103 and 104:
2 Radiative Foi c ing of Climate 55
- Page 105 and 106:
2 Radiatne Foi cinq of Climate 57 T
- Page 107 and 108:
2 Radiatn e Foi c mq of Climate 59
- Page 109 and 110:
2 Radiatn e Foi c mg of Climate 61
- Page 111 and 112:
2 Radunn e h01 c uiv, of Climate 63
- Page 113 and 114:
2 Radiatn c Foi c im> of Climate 65
- Page 115:
2 Radiatne Foicin of Climate 67 eru
- Page 119:
CONTENTS Executive Summary 73 3.1 I
- Page 123 and 124:
3 Pi ocesses and Modelling 75 3.1 I
- Page 125 and 126:
3 Pioc esses and Modelling 77 away
- Page 127 and 128:
3 Pi OC es tes and Modellm v, 79 wh
- Page 129 and 130:
Table 3.2(a): Summai\ of tesults po
- Page 131 and 132:
3 Pi OC esses and Modelling 83 3.5.
- Page 133 and 134:
3 Pi ocesses and Modelling 85 many
- Page 135 and 136:
3 Pi oc esses and Modelling 87 glob
- Page 137 and 138:
3 Pi OC esses and Modelling 89 from
- Page 139:
3 Pi OC esses and Modellm ? 91 Rava
- Page 145:
Executive Summary 1 The validation
- Page 148 and 149:
100 Validation of Climate Models 4
- Page 150 and 151:
102 Validation of Climate Models 4
- Page 154 and 155:
106 Validation of Climate Models 4
- Page 156 and 157:
I OH Validation of Climate Models 4
- Page 158:
(a) DJF PRECIPITATION: OBSERVED (b)
- Page 161 and 162:
4 Validation of Climate Models 113
- Page 163 and 164:
4 Validation of Climate Models IIS
- Page 165 and 166:
4 Validation of Climate Models 117
- Page 167 and 168:
4 Validation of Climate Models 119
- Page 169 and 170:
4 Validation of Climate Models 121
- Page 171 and 172:
4 Validation of Climate Models 121
- Page 173 and 174:
4 Validation of Climate Models 725
- Page 175 and 176:
4 Validation of Climate Models 127
- Page 177 and 178:
4 Validation of Climate Models 129
- Page 179:
5 Equilibrium Climate Change - and
- Page 183:
EXECUTIVE SUMMARY 1. All models sho
- Page 186 and 187:
nx Equihbi mm Climate Change 5 temp
- Page 191:
5 Equilibrium Climate Change 143 di
- Page 198:
150 Ec/uilibi mm Climate Change 5 1
- Page 202 and 203:
H4 Ec/uilibiiiim Climate Clninqe 5
- Page 204 and 205:
756 Equilibi mm Climate Change 5 Ta
- Page 206 and 207:
1SS Ec/mlibi nun Climate Change 5 S
- Page 208 and 209:
160 Eqmlibnum Climate Chcuis,e 5 im
- Page 210 and 211:
162 Equilibrium Climate Change 5 Or
- Page 212:
164 Cquilibi mm Climate Change 5 Sc
- Page 223: CONTENTS Executive Summary 177 6.1
- Page 227 and 228: 6 Time-Dependent Gi eenhoute-Gas In
- Page 229 and 230: 6 Time Dependent Gi eenhouse Gas-In
- Page 231 and 232: 6 Time Dependent Gi eenhouse Gas In
- Page 233: 6 Time-Dependent Gi eenhouse Gas-In
- Page 237 and 238: 6 Time-Dependent Gieenhouse Gas-Ind
- Page 239 and 240: 6 Time-Dependent Gieenhouse Gas Ind
- Page 241: 6 Time-Dependent Greenhouse Gas-Ind
- Page 245: CONTENTS Executive Summary 199 7.1
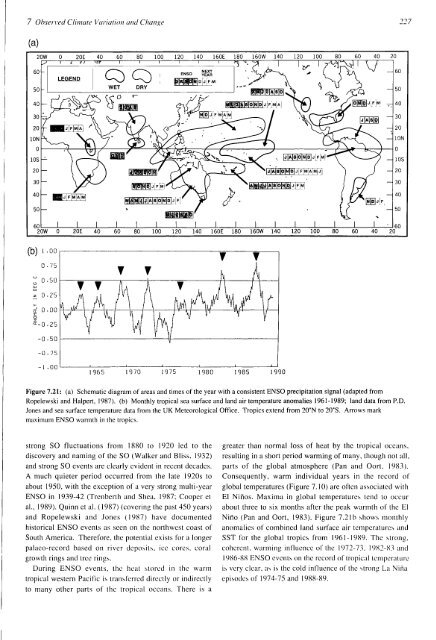
- Page 249 and 250: 7 ObseivedClimate Variation andChan
- Page 251 and 252: 7 Obsei ved Climate Vai tation and
- Page 253 and 254: 7 Observed Climate Variation and Ch
- Page 255 and 256: 7 Obsei \ eel Climate Vai iation an
- Page 257 and 258: 7 Obsei \ed Climate Vailatum and Ch
- Page 259 and 260: 7 Obsei ved Climate Vai tation and
- Page 261 and 262: 7 Observed Climate Variation and Ch
- Page 263 and 264: 7 Observed Climate Variation and Ch
- Page 265 and 266: 7 Obsei \ ed Climate Vai lation and
- Page 267 and 268: 7 Obsei ved Climate Va> mtion and C
- Page 269 and 270: 7 Obsei ved Climate Vai tation and
- Page 271 and 272: 7 Obsencd Climate Vernation and Cha
- Page 273: 7 Obsened Climate Vai lation and Ch
- Page 278: 2M) Obsenid Climate Vaimtion and Ch
- Page 281 and 282: 7 Obsened Climate Van at ion and Ch
- Page 283 and 284: 7 Obsei i ed Climate Vai lation and
- Page 285 and 286: 7 Obsei \ ed Climate Vai wtion and
- Page 287: 8 Detection of the Greenhouse Effec
- Page 291: EXECUTIVE SUMMARY Global-mean tempe
- Page 294 and 295: 246 Detec tion of the Gi eenhouse E
- Page 296 and 297: 248 Dctec tion of the Gieenhouse Ef
- Page 298 and 299: 250 Detec turn of the Gieenhouse Ef
- Page 300 and 301: 252 Detec tion of the Gi eenhouse E
- Page 302 and 303: 2S4 Detec tion of the Gi eenhouse E
- Page 305: 9 Sea Level Rise R. WARRICK, J. OER
- Page 309: EXECUTIVE SUMMARY This Section addr
- Page 312 and 313: 264 Sea Level Rise 9 In addition, s
- Page 314 and 315: 266 Sea Le\ el Rise 9 meteoiologica
- Page 318 and 319: 270 Sea Level Rise 9 Table 9.4 Esti
- Page 320 and 321: 272 Sea Level Rise 9 Table 9.6 Anta
- Page 322 and 323: 274 Sea Level Rise 9 Table 9.8 Esti
- Page 324 and 325:
276 Sea Le\ el Rise 9 each scenario
- Page 326 and 327:
278 Sea Level Rise 9 O 50 Stop chan
- Page 328 and 329:
2S0 Sea Level Rise 9 Gornit/, V and
- Page 331:
10 Effects on Ecosystems J.M. MELIL
- Page 335 and 336:
EXECUTIVE SUMMARY Ecosystem Metabol
- Page 337 and 338:
10 Effects on Ecosystems 289 10.0 I
- Page 339 and 340:
7 0 Effec ts on Eco system s 291 in
- Page 341:
10 Effects on Ecosystems 293 Table
- Page 344 and 345:
296 Effects on Ecosystems 10 will h
- Page 346 and 347:
29h Effet ts on Ecosys'ems 10 10 2
- Page 348 and 349:
mo Effec ti on Ec osystem s 10 Tabl
- Page 350 and 351:
302 Effects on Ecosystems 10 (N2O)
- Page 352 and 353:
M)4 Effec ts on Ecosystems 10 poten
- Page 354 and 355:
106 Effects on Ecosystems 10 38,000
- Page 356 and 357:
308 Effects on Ecosystems 10 Hardy,
- Page 359:
11 Narrowing the Uncertainties: A S
- Page 363:
EXECUTIVE SUMMARY The IPCC has the
- Page 366 and 367:
?/ the Unt ei tamties 11 Analysis o
- Page 368 and 369:
uo 11.2 3 Precipitation and Evapora
- Page 370 and 371:
322 Narr owing the Uncertainties 11
- Page 372 and 373:
U4 Nai i cm ing the Unc ei tamties
- Page 375:
Narrowing the Uncertainties 327 199
- Page 379 and 380:
Annex 331 A.l Introduction Modellin
- Page 381 and 382:
Annex 333 900 Ball 4000 .-• 3500
- Page 383 and 384:
Annex 335 the current atmospheric b
- Page 385:
Annex 337 E UJ w ui > UJ < ui u BaU
- Page 389:
Appendix 1 EMISSIONS SCENARIOS FROM
- Page 393 and 394:
Appendix 3 CONTRIBUTORS TO IPCC WG1
- Page 395 and 396:
Appendix 3 347 Contributors: P.A. A
- Page 397 and 398:
Appendix 3 P Ya Groisman A Gruber S
- Page 399:
Appendix 3 351 J.P. Grime R. Giffor
- Page 402 and 403:
354 Appendix 4 H. Kenway M. Manton
- Page 404 and 405:
356 Appendix 4 JAPAN H. Akimoto H.
- Page 406 and 407:
358 Appendix 4 B. Flannery M.Ghil I
- Page 409 and 410:
Appendix 6 ACRONYMS: PROGRAMMES & M
- Page 412 and 413:
364 Appendix 7 Special Names and Sy