

First Assessment Report - IPCC
First Assessment Report - IPCC
First Assessment Report - IPCC

Create successful ePaper yourself
Turn your PDF publications into a flip-book with our unique Google optimized e-Paper software.
274 Sea Level Rise 9<br />
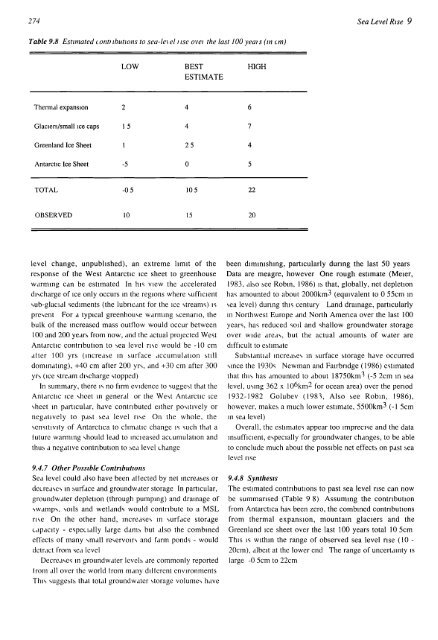
Table 9.8 Estimated conti ibutions to sea-le\ el i ise ovei the last 100 yeais (m cm)<br />
LOW<br />
BEST<br />
ESTIMATE<br />
HIGH<br />
Thermal expansion 2<br />
Glaciers/small ice caps 1 5<br />
Greenland Ice Sheet 1<br />
Antarctic Ice Sheet -5<br />
4<br />
4<br />
25<br />
0<br />
TOTAL -0 5 10 5 22<br />
OBSERVED 10 20<br />
level change, unpublished), an extreme limit of the<br />
response of the West Antarctic ice sheet to greenhouse<br />
warming can be estimated In his view the accelerated<br />
discharge of ice only occurs in the regions where sufficient<br />
sub-glacial sediments (the lubricant for the ice streams) is<br />
present For a typical greenhouse warming scenario, the<br />
bulk of the increased mass outflow would occur between<br />
100 and 200 years from now, and the actual projected West<br />
Antarctic contribution to sea level rise would be -10 cm<br />
alter 100 yrs (increase in surface accumulation still<br />
dominating), +40 cm after 200 yrs, and +30 cm after 300<br />
yrs (ice stream discharge stopped)<br />
In summary, there is no firm evidence to suggest that the<br />
Antarctic ice sheet in general or the West Antarctic ice<br />
sheet in particular, have contributed either positively or<br />
negatively to past sea level rise On the whole, the<br />
sensitivity of Antarctica to climatic change is such that a<br />
luture warming should lead to incieased accumulation and<br />
thus a negative contribution to sea level change<br />
9.4.7 Other Possible Contributions<br />
Sea level could also have been attected by net increases or<br />
decreases in surface and groundwater storage In particular,<br />
groundwater depletion (through pumping) and drainage of<br />
swamps, soils and wetlands would contribute to a MSL<br />
rise On the other hand, increases in surface storage<br />
capacity - especially large dams but also the combined<br />
effects of many small reservoirs and farm ponds - would<br />
detract from sea level<br />
Decreases in groundwater levels are commonly reported<br />
trom all over the world from many different environments<br />
This suggests that total groundwater storage volumes have<br />
been diminishing, particularly during the last 50 years<br />
Data are meagre, however One rough estimate (Meier,<br />
1983, also see Robin, 1986) is that, globally, net depletion<br />
has amounted to about 2000km3 (equivalent to 0 55cm in<br />
sea level) during this century Land drainage, particularly<br />
in Northwest Europe and North America over the last 100<br />
years, has reduced soil and shallow groundwater storage<br />
over wide areas, but the actual amounts of water are<br />
difficult to estimate<br />
Substantial increases in surface storage have occurred<br />
since the 1930s Newman and Fairbridge (1986) estimated<br />
that this has amounted to about 18750km^ (-5 2cm in sea<br />
level, using 362 x 106km2 for ocean area) over the period<br />
1932-1982 Golubev (1983, Also see Robin, 1986),<br />
however, makes a much lower estimate, 5500km3 (-1 5cm<br />
in sea level)<br />
Overall, the estimates appear too imprecise and the data<br />
insufficient, especially for groundwater changes, to be able<br />
to conclude much about the possible net effects on past sea<br />
level rise<br />
9.4.8 Synthesis<br />
The estimated contributions to past sea level rise can now<br />
be summarised (Table 9 8) Assuming the contribution<br />
from Antarctica has been zero, the combined contributions<br />
from thermal expansion, mountain glaciers and the<br />
Greenland ice sheet over the last 100 years total 10 5cm<br />
This is within the range of observed sea level rise (10 -<br />
20cm), albeit at the lower end The range of uncertainty is<br />
large -0 5cm to 22cm


