Environmental indicators - IPIECA
Environmental indicators - IPIECA
Environmental indicators - IPIECA

You also want an ePaper? Increase the reach of your titles
YUMPU automatically turns print PDFs into web optimized ePapers that Google loves.
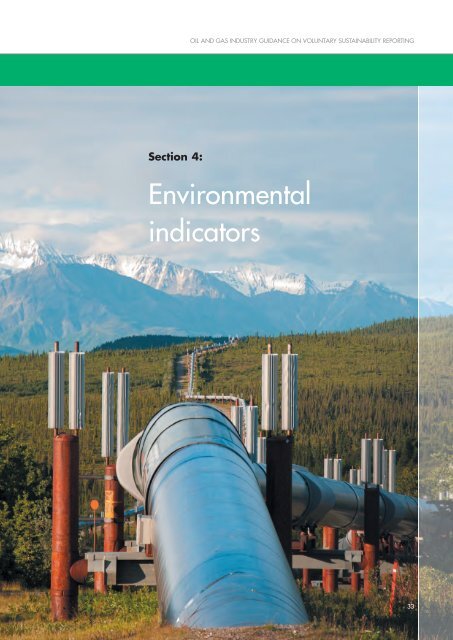
OIL AND GAS INDUSTRY GUIDANCE ON VOLUNTARY SUSTAINABILITY REPORTING<br />
Section 4:<br />
<strong>Environmental</strong><br />
<strong>indicators</strong><br />
33
<strong>IPIECA</strong> • API • OGP<br />
<strong>Environmental</strong> <strong>indicators</strong><br />
Section 4: <strong>Environmental</strong> <strong>indicators</strong><br />
<strong>Environmental</strong> <strong>indicators</strong>:<br />
an overview<br />
The oil and gas industr y recognizes that its<br />
operations have potential impacts on the<br />
environment. Some of the environmental impacts<br />
may also have health, safety, social and/or<br />
economic implications. Companies in the industr y<br />
generally have systematic processes in place to<br />
manage and reduce environmental impacts. The<br />
ten <strong>indicators</strong> in this section, grouped in three issue<br />
categories, describe the environmental systems,<br />
progress and performance of company operations.<br />
Consolidation and normalization of<br />
environmental data<br />
For environmental <strong>indicators</strong>, a company generally<br />
consolidates performance data for operated assets<br />
by applying the reporting boundary ‘operational<br />
approach’, except for GHG emissions where both<br />
the ‘operational approach’ and the ‘equity share<br />
approach’ may be applied (Appendix A).<br />
Indicators for spills, emissions and wastes can be<br />
expressed as absolute and/or normalized<br />
quantities. Absolute measures provide information<br />
on the scale of releases at the corporate, regional<br />
or local level. Normalized quantities facilitate<br />
comparisons among similar operations of<br />
different sizes (Section 3). Because of the var ying<br />
prices of oil and gas, nor malization based on the<br />
monetary value of outputs is not recommended.<br />
Instead, environmental data should be nor malized<br />
based on physical outputs such as production or<br />
throughput (Table 4, Section 3). Care is required<br />
to account for the differing nature of specific<br />
operations. Emissions from oil production, for<br />
example, vary depending on the need for<br />
enhanced oil recovery techniques and whether<br />
associated gas produced with the oil is flared or<br />
captured for sale. Similarly, refining emissions<br />
depend on the type of crude oil processed and<br />
the mix of products produced. One approach to<br />
dealing with process and/or feedstock dif ferences<br />
is to normalize data using a weighted measure of<br />
production or throughput. A good example is<br />
Solomon Associates’ Utilized Equivalent<br />
Distillation Capacity, which factors in the<br />
complexity of a refinery’s processes.<br />
Summary of environmental <strong>indicators</strong><br />
Issue category Indicator Page number<br />
Climate change and energy E1: Greenhouse gas emissions 36<br />
E2: Energy use 40<br />
E3: Alternative energy sources 43<br />
E4: Flared gas 45<br />
Ecosystem services E5: Biodiversity and ecosystem services 48<br />
E6: Fresh water 51<br />
Local environmental impact E7: Other air emissions 55<br />
E8: Spills to the environment 57<br />
E9: Discharges to water 60<br />
E10: Waste 62<br />
34
OIL AND GAS INDUSTRY GUIDANCE ON VOLUNTARY SUSTAINABILITY REPORTING<br />
<strong>Environmental</strong> <strong>indicators</strong><br />
Climate change and energy<br />
Introducing the issue:<br />
Climate change and energy<br />
Addressing the challenges and risks posed by<br />
climate change requires sustained efforts to<br />
develop understanding and effective response<br />
while meeting growing global needs for energy.<br />
Oil and gas will probably continue to account for<br />
a high proportion of primary energy demand<br />
globally for decades to come. Companies in the<br />
oil and gas industry endeavour to meet these<br />
energy supply needs. At the same time, they<br />
continue to take action to improve their<br />
operations and products, to promote and improve<br />
energy efficiency and to minimize greenhouse<br />
gas emissions. As a result, climate change is likely<br />
to be a material issue for the oil and gas industr y<br />
for years to come. As illustrated by example in<br />
Section 2, climate change and energy is a<br />
complex issue with implications for other<br />
environmental, social, health and economic<br />
issues. As such, a company may decide that other<br />
aspects of this issue, beyond the four <strong>indicators</strong><br />
suggested in this Guidance, may be material for<br />
inclusion in its sustainability report.<br />
The four <strong>indicators</strong> recommended are common to<br />
many companies. Of these, greenhouse gas<br />
(GHG) emissions metrics are well established and<br />
this indicator is only part of the extensive<br />
reporting protocols available to oil and gas<br />
companies from <strong>IPIECA</strong>, API, OGP and others.<br />
Energy use and flared gas are <strong>indicators</strong> of<br />
natural resource use, and are directly associated<br />
with GHG emissions; they are also related to local<br />
environmental impacts, and affect other<br />
environmental issue areas. Alternative energy<br />
sources is an indicator that enables repor ting on<br />
company investments in identifying and providing<br />
alternative and/or new renewable solutions.<br />
Section 4: <strong>Environmental</strong> <strong>indicators</strong><br />
35
<strong>IPIECA</strong> • API • OGP<br />
<strong>Environmental</strong> <strong>indicators</strong> Climate change and energy E1: Greenhouse gas emissions<br />
Section 4: <strong>Environmental</strong> <strong>indicators</strong><br />
Indicator:<br />
E1: Greenhouse gas (GHG) emissions<br />
Description<br />
Report quantity of greenhouse gas emissions,<br />
including carbon dioxide and methane, from<br />
combustion and other processes.<br />
Purpose<br />
Greenhouse gases are generated by most<br />
petroleum industry operations and contribute to<br />
aggregate global atmospheric GHG concentrations.<br />
This indicator demonstrates how companies track<br />
and manage their GHG emissions.<br />
Scope<br />
The following scope summarizes key aspects of<br />
the <strong>IPIECA</strong>/API/OGP Petroleum Industry<br />
Guidelines for Reporting Greenhouse Gas<br />
Emissions which is recommended for accounting<br />
and voluntary reporting of GHG emissions in the<br />
petroleum industry and should be referred to for<br />
detailed guidance on this indicator.<br />
Oil and gas companies should include<br />
significant GHG emissions to the atmosphere of<br />
six greenhouse gases covered under the Kyoto<br />
Protocol:<br />
● carbon dioxide (CO 2<br />
)<br />
● methane (CH 4<br />
)<br />
● nitrous oxide (N 2<br />
O)<br />
● hydrofluorocarbons (HFCs)<br />
● perfluorocarbons (PFCs)<br />
● sulphur hexafluoride (SF 6<br />
)<br />
For oil and natural gas operations, CO 2<br />
and CH 4<br />
are usually the most significant components of<br />
GHG emissions. N 2<br />
O is emitted in ver y small<br />
quantities from the combustion of fossil fuels and<br />
its GHG contribution may be insignificant<br />
compared to CO 2<br />
. Depending on the company’s<br />
operations, the other greenhouse gases—HFCs<br />
and PFCs used in refrigeration, and SF 6<br />
used in<br />
electrical equipment and sometimes as a tracer in<br />
pipelines—may or may not make a substantial<br />
contribution relative to the total GHG emissions<br />
from a company’s operations. For each listed<br />
GHG determined to be a significant contributor to<br />
total emissions, it is good practice to repor t<br />
annual emissions in metric tonnes and/or the<br />
CO 2<br />
equivalent (CO 2<br />
e) of each GHG, where the<br />
CO 2<br />
e is calculated in accordance with published<br />
global warming potential (GWP) factors. To<br />
date, the preferred source for global war ming<br />
potential factors is the IPCC’s Second Assessment<br />
Report (1995).<br />
GHG emissions from all company business<br />
activities should be included:<br />
● combustion emissions (e.g. fuel use in gas<br />
compression, power generation, heating, coke<br />
burn);<br />
● flaring and venting;<br />
● process emissions (e.g. vessel loading, tank<br />
storage and flushing, glycol dehydration,<br />
sulphur recovery units, hydrogen production);<br />
● fugitive emissions of GHG gases (including<br />
piping and equipment leaks); and<br />
● non-routine events (e.g. pipeline maintenance,<br />
gas releases, equipment maintenance).<br />
GHG emissions estimates should include<br />
significant stationary and mobile sources.<br />
Stationary sources may include equipment at well<br />
sites, production facilities, refineries, chemical<br />
plants, terminals, fixed site drilling rigs and of fice<br />
buildings. Mobile sources may include marine<br />
vessels transporting products, tank truck fleets,<br />
mobile drilling rigs, and moveable equipment at<br />
drilling and production facilities.<br />
Direct GHG emissions result from equipment or<br />
other sources owned (partly or wholly) and/or<br />
operated by the company. These correspond to<br />
36
OIL AND GAS INDUSTRY GUIDANCE ON VOLUNTARY SUSTAINABILITY REPORTING<br />
<strong>Environmental</strong> <strong>indicators</strong> Climate change and energy E1: Greenhouse gas emissions<br />
Scope 1 emissions as defined by the World<br />
Resources Institute and the World Business Council<br />
on Sustainable Development (WRI/WBCSD)<br />
Greenhouse Gas Protocol. Where an operation<br />
purchases energy already transformed into<br />
electricity, heat or steam, the GHGs emitted to<br />
produce this energy should be repor ted as Indirect<br />
GHG emissions from imported energy (Scope 2<br />
emissions per the WRI/WBCSD Greenhouse Gas<br />
Protocol). Some companies choose to repor t Other<br />
indirect emissions (Scope 3 emissions per the<br />
WRI/WBCSD Greenhouse Gas Protocol) which<br />
represent the indirect emissions that result from a<br />
company’s activities that are not Scope 2 emissions.<br />
The common reporting elements (see page 39)<br />
are based on direct GHG emission repor ting; one<br />
of the supplemental reporting elements provides<br />
for reporting indirect GHG emissions. Where par t<br />
of an asset’s direct emission relates to expor ted<br />
energy, it can be separately accounted for in<br />
other reporting elements.<br />
Based on current practice, the following are not<br />
typically included by companies in their GHG<br />
emissions reporting:<br />
● ozone-depleting gases such as<br />
chlorofluorocarbons (CFCs) and<br />
hydrochlorofluorocarbons (HCFCs), since these<br />
are not among the six Kyoto gases; and<br />
● CO 2<br />
sold as product, used for enhanced oil<br />
recovery, or sequestered (e.g. via carbon<br />
capture and sequestration).<br />
Reporting basis<br />
Total emissions are reported quantitatively at the<br />
company level as CO 2<br />
e (reflecting the global<br />
warming potential of all of the GHG species) and<br />
as emissions of the individual gases expressed in<br />
mass and/or CO 2<br />
e. Measurement units are:<br />
● Total GHG (direct, indirect from impor ted<br />
energy, direct GHG for exported energy):<br />
metric tonnes CO 2<br />
equivalent (where<br />
CO 2<br />
e = the sum of the products of each GHG<br />
Section 4: <strong>Environmental</strong> <strong>indicators</strong><br />
37
<strong>IPIECA</strong> • API • OGP<br />
<strong>Environmental</strong> <strong>indicators</strong> Climate change and energy E1: Greenhouse gas emissions<br />
Section 4: <strong>Environmental</strong> <strong>indicators</strong><br />
gas multiplied by its respective GWP relative to<br />
CO 2<br />
, in metric tonnes); and<br />
● GHG species (i.e. when reporting individual<br />
gases): metric tonnes and/or metric tonnes<br />
CO 2<br />
equivalent (where CO 2<br />
e = the product of<br />
metric tonnes of the GHG species of interest by<br />
its GWP relative to CO 2<br />
).<br />
Companies should clearly identify the specific<br />
GHG species included in their emission estimates.<br />
Data should be consolidated within the company’s<br />
reporting boundary using either the ‘operational’<br />
or the ‘equity share’ approach, or both<br />
approaches (Appendix A), and can consider the<br />
alternative ‘financial’ approach. Reporting<br />
boundaries and these data consolidation<br />
approaches are defined and discussed in detail in<br />
Chapter 3 of the <strong>IPIECA</strong>/API/OGP Petroleum<br />
Industry Guidelines for Reporting Greenhouse<br />
Gas Emissions. Companies should clearly state<br />
the consolidation approaches used.<br />
Definition of terms<br />
• Direct GHG emissions: total GHG emitted from sources at a facility owned (par tly or wholly)<br />
and/or operated by the company. Direct GHG emissions correspond to Scope 1 emissions as<br />
defined by WRI/WBCSD.<br />
• Indirect GHG emissions from imported energy: GHG emissions that occur at the point of energy<br />
generation (owned or operated by a third par ty) for electricity, heat or steam imported (i.e.<br />
purchased) for use on site by the repor ting entity. Indirect GHG emissions from impor ted energy<br />
correspond to Scope 2 emissions as defined by WRI/WBCSD.<br />
• Direct GHG emissions from exported energy: GHG emissions related to production of energy in<br />
the form of electricity, heat or steam exported (i.e. sold) by the repor ting entity to a facility owned<br />
or operated by a third par ty. This is a subset of direct GHG emissions.<br />
• GHG intensity: GHG emissions divided by the appropriate nor malization factor for the business<br />
segment. This metric can be useful in comparing per formance within a company’s business<br />
segments (e.g. within production or within refining). See Section 3 for additional infor mation on<br />
normalization.<br />
• Direct GHG emissions from cogeneration: GHG emissions related to production of electricity and<br />
steam in cogeneration (simultaneous production of power and useful heat). This subset of direct<br />
GHG emissions typically results in a reduction of GHG emissions from a public utility .<br />
• Other indirect emissions: Correspond to Scope 3 emissions as defined by the WRI/WBCSD GHG<br />
Protocol, and as described in detail in the <strong>IPIECA</strong>/API/OGP Petroleum Industry Guidelines for<br />
Reporting Greenhouse Gas Emissions. They represent indirect emissions that result from a<br />
company’s activities that are not Scope 2 emissions. Examples include emissions from the<br />
manufacture of purchased raw materials (such as hydrogen or steel), emissions from third-par ty<br />
vessels or vehicles transporting company products or employees, or emissions from customer use of<br />
the company’s fuel products.<br />
38
OIL AND GAS INDUSTRY GUIDANCE ON VOLUNTARY SUSTAINABILITY REPORTING<br />
<strong>Environmental</strong> <strong>indicators</strong> Climate change and energy E1: Greenhouse gas emissions<br />
Reporting elements<br />
Common reporting elements<br />
Supplemental reporting elements<br />
● Direct GHG emissions (Scope 1), consolidated<br />
● Direct GHG emissions (Scope 1),<br />
consolidated using either the operational<br />
or equity share approach, to include:<br />
• direct CO 2<br />
• direct CH 4<br />
●<br />
using both operational and equity share<br />
approaches.<br />
Indirect GHG emissions related to purchased<br />
energy (report separately from direct emissions)<br />
(Scope 2).<br />
● Separately report GHG species which contribute<br />
significantly to total direct GHG emissions<br />
(Scope 1).<br />
● GHG emissions and/or intensity, by business<br />
activity (e.g. oil and gas production, refining).<br />
Section 4: <strong>Environmental</strong> <strong>indicators</strong><br />
Other reporting elements<br />
● Breakdown of major source categories for GHG emissions (e.g. combustion [stationar y], flaring,<br />
venting, process, product transport). Companies should discuss their approach to managing GHG<br />
emissions overall or within the source categories. For example, describe strategies to improve energy<br />
efficiency, reduce flaring, increase use of cogeneration, sequester carbon and improve the ef ficiency<br />
of the use of the company’s products.<br />
● Emissions related to activities of special interest (e.g. oil sands) can be noted separately if these<br />
represent a substantial portion of the company’s GHG profile.<br />
● Separately report substantial direct GHG emissions associated with the cogeneration of heat and<br />
power.<br />
● Separately report substantial direct GHG emissions related to generation of energy expor ted.<br />
● Companies may choose to separately repor t other indirect GHG emissions (WRI/WBCSD Scope 3),<br />
for example those related to use of petroleum products: see also the <strong>IPIECA</strong>/API/OGP Petroleum<br />
Industry Guidelines for Reporting Greenhouse Gas Emissions.<br />
References<br />
1. API. 2009. Compendium of Greenhouse Gas Emission Estimation Methodologies for the Oil and Natural Gas Industr y.<br />
www.api.org/ehs/climate/new/upload/2009_GHG_COMPENDIUM.pdf<br />
2. IPCC. 1995. Second Assessment Report—Climate Change 1995: The Science of Climate Change .<br />
www.ipcc.ch/ipccreports/sar/wg_I/ipcc_sar_wg_I_full_report.pdf<br />
3. IPCC. 2007. ’Changes in Atmospheric Constituents and in Radiative Forcing‘ (Chapter 2), in Climate Change 2007: The Physical<br />
Science Basis. Contribution of Working Group I to the Four th Assessment Report of the Intergovernmental Panel on Climate<br />
Change (2007) [Solomon, S., D. Qin, M. Manning, Z. Chen, M. Mar quis, K.B. Averyt, M.Tignor and H.L. Miller (eds.)].<br />
Cambridge University Press. www.ipcc.ch/pdf/assessment-report/ar4/wg1/ar4-wg1-chapter2.pdf<br />
4. <strong>IPIECA</strong>/API/OGP. 2011. Petroleum Industry Guidelines for Reporting Greenhouse Gas Emissions. Scheduled for publication in<br />
2011. www.ipieca.org<br />
5. WRI/WBCSD. 2004. The Greenhouse Gas Protocol: A Corporate Accounting and Repor ting Standard (Revised Edition, March,<br />
2004). www.wri.org/publication/greenhouse-gas-protocol-corporate-accounting-and-reporting-standard-revised-edition<br />
39
<strong>IPIECA</strong> • API • OGP<br />
<strong>Environmental</strong> <strong>indicators</strong> Climate change and energy E2: Energy use<br />
Section 4: <strong>Environmental</strong> <strong>indicators</strong><br />
Indicator:<br />
E2: Energy use<br />
Description<br />
Report total quantity of energy consumed in oil<br />
and gas operations or other business activities.<br />
Purpose<br />
Energy use is an indicator of resource use and is<br />
associated with the generation of GHGs and<br />
other air emissions. Energy-related emissions to<br />
the atmosphere are aggregated within <strong>indicators</strong><br />
E1, GHG emissions and E7, Other air emissions.<br />
Scope<br />
Reporters should state the total energy consumed<br />
to operate their facilities and equipment. This<br />
includes the direct energy produced by operations<br />
(less any energy exported), as well as energy<br />
associated with the import of electricity, heat and<br />
steam. To reflect resource use, energy is repor ted<br />
as primary energy (i.e. the energy content of the<br />
hydrocarbon fuels or other sources used to<br />
produce the energy ultimately consumed by the<br />
company’s operations).<br />
Direct energy results from self-generation of<br />
mechanical power, electricity, heat or steam on<br />
the company‘s operating sites, as well as in of fice<br />
buildings, marine vessels, trucks, or other<br />
stationary or mobile equipment under the<br />
operational control of the reporting company.<br />
Examples of energy-consuming equipment<br />
include boilers, fired heaters, waste incinerators,<br />
gas turbines, gas engines and diesel engines.<br />
Direct energy use is a measure of the energy<br />
content of the fuels or other energy sources used<br />
to produce the power or heat generated directly<br />
at the facility.<br />
Direct energy should reflect combustion of fuels,<br />
whether produced by the company or purchased.<br />
Energy from fuel combustion should be<br />
determined as follows:<br />
● Preferred: calculated based on the fuel volume<br />
consumed and the fuel energy content of the<br />
fuels used to generate the required energy.<br />
Calculation may be carried out by total fuel<br />
consumed if the same fuel is used by all<br />
energy sources, or by source if fuel types var y.<br />
Use of ‘lower heating value’ is recommended<br />
because this reflects the amount of useable<br />
energy consumed and its use will promote a<br />
consistent reporting basis. Use of ‘upper<br />
heating value’ in place of ‘lower heating value’<br />
will increase the reported energy consumption<br />
by up to 10%.<br />
● Alternative: estimate based on the design<br />
energy consumption specifications associated<br />
with various processing equipment, augmented<br />
with run time or throughput infor mation if<br />
available.<br />
On-site generation of solar or wind electric power<br />
or other non-combustion energy sources should<br />
be included and calculated simply from the<br />
electricity generated by these sources.<br />
Exported energy is the subset of the direct<br />
primary energy sold or other wise exported from<br />
the facility for use by others. It includes energy<br />
losses from the company‘s own power generation<br />
equipment.<br />
This indicator quantifies energy use related to oil<br />
and gas operations and, therefore, excludes<br />
exported energy not available to suppor t on-site<br />
operations. As a consequence, companies with<br />
material export contributions from power plants<br />
or cogeneration plants may choose to repor t<br />
energy use related to generation of expor ted<br />
power separately to provide a clearer picture of<br />
overall resource use.<br />
40
OIL AND GAS INDUSTRY GUIDANCE ON VOLUNTARY SUSTAINABILITY REPORTING<br />
<strong>Environmental</strong> <strong>indicators</strong> Climate change and energy E2: Energy use<br />
Imported energy should reflect the energy content<br />
of the fuels that the supplier uses to produce<br />
electricity, heat or steam imported by the<br />
company. This approach is used to reflect the use<br />
of primary energy resources. For example,<br />
imported energy derived from a thermal power<br />
generation plant would be the energy content of<br />
the fuel combusted by the provider to produce the<br />
electrical power received by the company‘s<br />
facility. Imported energy accounts for the<br />
efficiency loss during the transformation of fuel<br />
combusted at the power plant into electricity, heat<br />
or steam.<br />
Imported energy is calculated by using the<br />
purchased records of electricity, heat or steam,<br />
and then using efficiency factors to convert back to<br />
the energy content of the fuels or energy sources.<br />
For purchased electricity, the imported electricity is<br />
converted to an estimate of the energy actually<br />
used by applying a local ‘grid factor’ that reflects<br />
the average thermal efficiency (i.e. energy content<br />
of the fuel versus energy produced) for the mix of<br />
electrical generation facilities providing electricity<br />
to the local electrical grid. For purchased heat or<br />
steam, efficiency factors can typically be obtained<br />
from the supplier.<br />
In the absence of efficiency or grid factors,<br />
including specific information from the energy<br />
provider, it is possible to use published grid<br />
factors such as those provided by the API<br />
Compendium, the US EPA E-GRID factors or other<br />
sources available in the countr y of operation.<br />
Alternatively, it may be necessar y to use<br />
published conversion factors and information on<br />
the type of generating unit supplying the energy.<br />
In the absence of local or regional infor mation,<br />
the following efficiency factors can be used for<br />
combustion-based energy sources:<br />
● energy content of the fuel used to generate the<br />
electricity = electricity purchased/received in<br />
gigajoules (GJ) divided by 0.38<br />
● energy content of the fuel used to generate the<br />
steam = steam purchased/received in GJ<br />
divided by 0.8<br />
The factors provided are conser vative values to<br />
account for efficiency losses during generation<br />
and transportation of power but do not reflect the<br />
efficiency of the most recent power generation<br />
technology. If electricity imported comes solely<br />
from non-combustion and non-nuclear generation<br />
(e.g. wind, hydroelectric, wave, tidal power) there<br />
is no need to apply a grid factor; simply repor t<br />
the imported energy purchased.<br />
Total energy use reported should include direct<br />
energy and imported energy but exclude<br />
exported energy to quantify energy consumed by<br />
a company’s oil and gas operations.<br />
Out of scope<br />
The energy content of flared or vented gas should<br />
be excluded from total energy use estimates.<br />
Although these do reflect loss of energy resources,<br />
they do not reflect energy use required for<br />
production or manufacturing of products. These<br />
resource losses are covered by a separate metric,<br />
E4, Flared gas.<br />
Reporting basis<br />
Report in gigajoules (one British Ther mal Unit<br />
[BTU] = 1055 joules; 1 kilowatt-hour (kWh) =<br />
0.0036 gigajoules). Energy data should be<br />
consolidated within the company’s reporting<br />
boundary using the ‘operational approach’<br />
(Appendix A).<br />
Section 4: <strong>Environmental</strong> <strong>indicators</strong><br />
41
<strong>IPIECA</strong> • API • OGP<br />
<strong>Environmental</strong> <strong>indicators</strong> Climate change and energy E2: Energy use<br />
Section 4: <strong>Environmental</strong> <strong>indicators</strong><br />
Definition of terms<br />
• Total energy use: direct energy + indirect energy – exported energy<br />
• Direct energy: energy resource consumption by the facility or its equipment expressed as the primar y<br />
energy needed to produce the power or heat required. This includes the energy content of selfgenerated<br />
and purchased fuel consumed, as well as the energy from other renewable (e.g. wind,<br />
solar) and non-renewable sources, but excludes the energy content of flared or vented gas.<br />
• Imported energy: amount of primary energy required to produce purchased power, most typically<br />
as electricity, heat or steam.<br />
• Exported energy: amount of direct primary energy exported for use by others, most typically as<br />
electricity, heat or steam.<br />
• Energy intensity: total energy use divided by the appropriate nor malization factor for the business<br />
segment (e.g. production volume, refinery throughput). See Section 3 for guidance on nor malization.<br />
Reporting elements<br />
Common reporting elements<br />
Supplemental reporting elements<br />
● Total energy use. ● Exported energy (if power generation for expor t<br />
represents a material contribution to energy profile).<br />
● Energy intensity by business activity (e.g. oil and<br />
gas production, refining).<br />
Other reporting elements<br />
● Initiatives and progress towards improving energy ef ficiency and consuming less energy. For<br />
example, many companies are producing energy on site and using combined heat and power (CHP ,<br />
also known as cogeneration) plants to improve energy ef ficiency.<br />
● Progress in managing energy consumption through use of energy-use indices, comparing current<br />
energy use per unit product produced to a historical reference point.<br />
● For refineries and chemical plants, indices that account for facility-specific infrastructure and<br />
operation conditions can be used to provide comparability of energy ef ficiency performance.<br />
Solomon Associates’ Energy Intensity Index, for example, is used for facility-specific analysis of<br />
refinery energy performance. Companies may wish to repor t on trends in these or other indices to<br />
track progress of energy-use management.<br />
● Report on what a company does to promote ef ficient customer use of energy.<br />
References<br />
1. API. 2009. Compendium of Greenhouse Gas Emission Estimation Methodologies for the Oil and Natural Gas Industr y.<br />
www.api.org/ehs/climate/new/upload/2009_GHG_COMPENDIUM.pdf<br />
2. <strong>IPIECA</strong>/API/OGP. 2011. Petroleum Industry Guidelines for Reporting Greenhouse Gas Emissions. Scheduled for publication in<br />
2011. www.ipieca.org<br />
3. North American Manufacturing. 1986. North American Combustion Handbook, Volume I: Combustion, Fuels, Stoichiometry, Heat<br />
Transfer, Fluid Flow. ISBN 0-9601596-2-2 (Third Edition, Cleveland, Ohio, 1986).<br />
42
OIL AND GAS INDUSTRY GUIDANCE ON VOLUNTARY SUSTAINABILITY REPORTING<br />
<strong>Environmental</strong> <strong>indicators</strong> Climate change and energy E3: Alter native energy sources<br />
Indicator:<br />
E3: Alternative energy sources<br />
Description<br />
Report qualitatively on company research, plans<br />
or current initiatives related to alternative or<br />
renewable energy sources.<br />
Purpose<br />
To meet growing global demand, a wide variety<br />
of energy sources, including low-carbon energy<br />
sources, will be needed. This indicator facilitates<br />
reporting of company activities in developing,<br />
supplying and/or using non-fossil fuel energy,<br />
particularly alternative and renewable energy<br />
resources. It helps to communicate a company’s<br />
approach to sustaining energy supplies through<br />
use and development of innovative technologies<br />
to conserve non-renewable energy sources, or<br />
through development, marketing and use of<br />
energy that is less carbon intensive.<br />
They should describe plans and projects that<br />
drive renewable energy development, production<br />
and use.<br />
Reporting basis<br />
This indicator is largely qualitative and can<br />
include examples to illustrate application of the<br />
indicator at the local level. When repor ting<br />
alternative/renewable energy production, the<br />
preferred unit is gigajoules and data should be<br />
consolidated within the company’s reporting<br />
boundary using the ‘operational approach’<br />
(Appendix A).<br />
Section 4: <strong>Environmental</strong> <strong>indicators</strong><br />
Scope<br />
Reporting of a company’s strategy with regard to<br />
its production of alternative/renewable energy for<br />
sale and/or for internal use may include<br />
quantitative or qualitative information such as:<br />
● production of alternative/renewable energy,<br />
either for internal use or sale;<br />
● if producing alternative energy from multiple<br />
sources, provide a breakdown by source; and<br />
● if producing biomass or biofuel energy, discuss<br />
associated material issues such as emissions,<br />
indirect land-use changes, water use, social<br />
issues and lifecycle assessment of carbon<br />
reductions.<br />
Companies should discuss their efforts to develop<br />
technologies that support renewable or alternative<br />
energy sources as well as expand energy supplies.<br />
43
<strong>IPIECA</strong> • API • OGP<br />
<strong>Environmental</strong> <strong>indicators</strong> Climate change and energy E3: Alter native energy sources<br />
Section 4: <strong>Environmental</strong> <strong>indicators</strong><br />
Definition of terms<br />
• Alternative energy: energy derived from non-fossil fuel sources. Nuclear energy, while it is a nonfossil<br />
fuel, is typically not included as an alter native fuel.<br />
• Renewable energy: energy sources that are constantly renewed by natural processes. These<br />
include non-carbon technologies such as solar energy, hydropower and wind, as well as<br />
technologies based on biomass. Lifecycle analyses are required to assess the extent to which such<br />
biomass-based technologies may limit net carbon emissions.<br />
• Biofuel: fuel produced from organic matter produced by plants. Examples of biofuels include<br />
alcohol (from fermented sugar), black liquor from the paper manufacturing process, wood, and<br />
palm and soybean oil.<br />
• Biomass: Total dry organic matter or stored energy content of living organisms. Biomass can be<br />
used for fuel directly by bur ning it (e.g. wood), indirectly by fer mentation to an alcohol (e.g. sugar)<br />
or extraction of combustible oils (e.g. soybeans).<br />
Reporting elements<br />
Common reporting elements<br />
●<br />
Discuss approach to alternative/<br />
renewable energy, including descriptions<br />
of relevant operations activities,<br />
investment plans or research and<br />
development projects and activities.<br />
Supplemental reporting elements<br />
●<br />
●<br />
●<br />
Discuss management of environmental and social<br />
issues surrounding any production of biofuel<br />
energy.<br />
Amount of alternative/renewable energy produced<br />
for sale.<br />
Amount of alternative/renewable energy produced<br />
for internal company use.<br />
Other reporting elements<br />
●<br />
●<br />
●<br />
Companies are encouraged to discuss their outlook on the supply and demand for energy , its<br />
implications for sustainability and their related investments in reducing the carbon footprint of fossil<br />
fuels as well as developing renewable/alternative energy supplies.<br />
Report on significant use of alter native/renewable energy sourced from third par ties, such as<br />
renewable energy purchased from a utility supplier.<br />
Although nuclear energy is not typically considered to be an alter native fuel, companies with<br />
significant activities in nuclear energy production may describe their activities and separately repor t<br />
nuclear energy produced or used.<br />
References<br />
1. <strong>IPIECA</strong>. 2007. Climate Change: A Glossary of Terms (Fourth edition, April 2007)<br />
www.ipieca.org/publication/climate-change-glossary-terms-4th-edition<br />
44
OIL AND GAS INDUSTRY GUIDANCE ON VOLUNTARY SUSTAINABILITY REPORTING<br />
<strong>Environmental</strong> <strong>indicators</strong> Climate change and energy E4: Flared gas<br />
Indicator:<br />
E4: Flared gas<br />
Description<br />
Report the quantity of hydrocarbon gas flared to<br />
the atmosphere from operations.<br />
Purpose<br />
The Flared gas indicator is a measure of natural<br />
gas resource consumption and an impor tant<br />
contributor, in some locations, to GHG emissions<br />
and to other gases that may impact the local<br />
environment.<br />
Scope<br />
Gas flare systems are an essential safety<br />
mechanism in many petroleum operations. Flares<br />
can, for example, safely combust gas released<br />
from pressure relief valves and other safety<br />
systems during plant upsets, gas released from<br />
various process or storage equipment, and nonmarketable<br />
or unusable gas. Sources and<br />
situations that may feed gas into flare systems can<br />
include but are not limited to:<br />
● pressure relief valve systems used to prevent<br />
overpressure of equipment;<br />
● emergency depressurizing systems used for<br />
safe plant management;<br />
● operations during plant start-ups and shut-downs;<br />
● tank storage overhead vapours (e.g. filling and<br />
breathing losses);<br />
● glycol dehydrators;<br />
● solution gas from separators or flash tanks at<br />
crude oil batteries, terminals or other<br />
production facilities;<br />
● well testing, especially at newly-drilled wells in<br />
frontier areas;<br />
● well completion and clean-up operations where<br />
flaring is necessary for well-bore and reser voir<br />
clean-up;<br />
● blow-down and pigging operations on gas<br />
gathering or other pipeline systems;<br />
● blow-downs of vessels, piping, gas<br />
compressors, or other equipment during<br />
maintenance; and<br />
● vessel and tank truck loading emissions (e.g.<br />
vapours displaced during loading of tankers or<br />
trucks).<br />
Companies should report as flared gas the total<br />
mass of hydrocarbon gas sent to operational flare<br />
systems at a facility. This should include routine<br />
flaring operations as well as any non-routine<br />
flaring events. Reported flared gas should include<br />
the hydrocarbon mass of purge gas, pilot light<br />
fuel and assist gas, if these are substantial relative<br />
to the total mass flared. Data on insignificant<br />
quantities of flared gases are not generally<br />
collected or reported.<br />
Calculation of flared gas should be based on the<br />
composition of the gas stream involved and<br />
should exclude the mass of non-hydrocarbons,<br />
such as CO 2<br />
, water, H 2<br />
and N 2<br />
. In the absence of<br />
measured gas composition data, engineering<br />
estimates should be applied.<br />
For most petroleum industry operations, venting of<br />
hydrocarbons represents a minor resource use<br />
and related emissions are effectively covered by<br />
indicator E1, GHG emissions, and by the volatile<br />
organic compounds (VOC) metric under indicator<br />
E7, Other air emissions. If gas venting is<br />
substantial, companies may separately report the<br />
mass of vented hydrocarbon gas.<br />
Reporting basis<br />
Report quantitatively using units of metric tonnes<br />
of hydrocarbons flared. Reporting in units of mass<br />
is encouraged because this provides a more<br />
consistent and comparable measure of product<br />
loss. Flare volumes may be repor ted in standard<br />
cubic metres (Sm 3 ) or standard cubic feet (Scf) if<br />
Section 4: <strong>Environmental</strong> <strong>indicators</strong><br />
45
<strong>IPIECA</strong> • API • OGP<br />
<strong>Environmental</strong> <strong>indicators</strong> Climate change and energy E4: Flared gas<br />
Section 4: <strong>Environmental</strong> <strong>indicators</strong><br />
reporting on a volume basis, which is commonly<br />
used in industry operations and may be better<br />
understood by some audiences. When repor ting<br />
volume, specify units used and the temperature/<br />
pressure bases for the standardization.<br />
Flared gas data should be consolidated within the<br />
company’s reporting boundary using the<br />
‘operational approach’ (Appendix A).<br />
Data should be consolidated for all operational<br />
activities which contribute materially to the<br />
company’s total flared gas.<br />
Definition of terms<br />
• Flared gas: total mass (or volume) of hydrocarbon directed to operational flare systems, wherein<br />
the hydrocarbons are consumed through combustion.<br />
Reporting elements<br />
Common reporting elements<br />
●<br />
Quantity of hydrocarbon gas flared from<br />
operations.<br />
Supplemental reporting elements<br />
●<br />
Separately report hydrocarbon gas flared for each<br />
relevant business activity (e.g. oil and gas<br />
production, refining).<br />
Other reporting elements<br />
● Contribution of flaring to the company’s total GHG emissions in CO 2<br />
e.<br />
● Reporting flaring by type can convey the causes of flaring and indicate areas for operational<br />
improvement. For example, flaring can be split between routine causes (e.g. nor mal operations, well<br />
testing) and non-routine causes (e.g. plant star t-ups and shut-downs, pressure safety valve releases,<br />
emergency depressurization).<br />
● Describe flare reduction activities including sustainable reduction improvements versus shor t-term<br />
operational fluctuations.<br />
● Separately report vented gas if hydrocarbon venting represents a substantial por tion of a company’s<br />
resource use.<br />
References<br />
1. API. 2009. Compendium of Greenhouse Gas Emission Estimation Methodologies for the Oil and Natural Gas Industr y.<br />
www.api.org/ehs/climate/new/upload/2009_GHG_COMPENDIUM.pdf<br />
2. <strong>IPIECA</strong>/API/OGP. 2011. Petroleum Industry Guidelines for Reporting Greenhouse Gas Emissions. Scheduled for publication in<br />
2011. www.ipieca.org<br />
3. US EPA. Compilation of Air Pollutant Emission Factors, Volume I: Stationary Point and Areas Sources, AP-42 (GPO 055-000-005-<br />
001). US EPA Office of Air Quality Planning and Standards (Fifth Edition, Januar y 1995, with Supplements A, B and C, October<br />
1996, and Supplement D, 1998). www.epa.gov/ttnchie1/ap42<br />
46
OIL AND GAS INDUSTRY GUIDANCE ON VOLUNTARY SUSTAINABILITY REPORTING<br />
<strong>Environmental</strong> <strong>indicators</strong><br />
Ecosystem ser vices<br />
Introducing the issue:<br />
Ecosystem services<br />
Ecosystems generate benefits ranging from fresh<br />
water and timber to pollination and climate<br />
regulation. Ecosystem services are fundamental to<br />
environmental sustainability, societal well-being<br />
and economic prosperity. Ecosystem services are<br />
distinguished from natural resources, such as<br />
minerals and fossil fuels, by the timeframe. The<br />
quantity and quality of ecosystem ser vices<br />
depend on the living component of existing<br />
ecosystems; natural resources such as fossil fuels<br />
derive from organic material that was alive<br />
millions of years ago.<br />
Companies depend on, and affect, ecosystem<br />
services and the underlying biodiversity. Pressures<br />
such as climate change and population growth may<br />
cause sufficient degradation that some ecosystems<br />
may require conservation measures if their benefits<br />
are to continue. Companies can incorporate<br />
ecosystem services into their management systems<br />
and identify strategies for dealing with risks and<br />
opportunities for both ecosystems and business.<br />
In developing reporting related to ecosystems, the<br />
<strong>indicators</strong> focus on biodiversity and on the<br />
ecosystem service of fresh water, as both can be<br />
impacted by oil and gas industr y operations. They<br />
can also be enhanced by good stewardship. Given<br />
the breadth of concern for ecosystems, the categor y<br />
of <strong>indicators</strong> will most likely continue to expand in<br />
the future.<br />
Biodiversity and some ecosystem ser vices are not<br />
easy to quantify and aggregate. The choice of a<br />
company’s reporting elements will depend on the<br />
particular challenges faced in any given area. This<br />
may suggest that qualitative information, such as<br />
case studies, will be more appropriate in some<br />
cases, whereas in others, location-specific<br />
quantitative data may be provided so that aspects<br />
related to local ecosystems can be taken into account.<br />
With an ecosystem service such as fresh water, for<br />
example, challenges are likely to var y across a<br />
company’s operating areas. Fresh water is amenable<br />
to quantitative, and therefore aggregated,<br />
measurement. However the associated potential<br />
impacts may be highly localized—for instance,<br />
related to operations in areas of fresh water<br />
scarcity—so case studies can be beneficial when<br />
reporting on this indicator. (See the example on<br />
Working in remote locations in Section 2.)<br />
Section 4: <strong>Environmental</strong> <strong>indicators</strong><br />
47
<strong>IPIECA</strong> • API • OGP<br />
<strong>Environmental</strong> <strong>indicators</strong> Ecosystem ser vices E5: Biodiversity and ecosystem ser vices<br />
Section 4: <strong>Environmental</strong> <strong>indicators</strong><br />
Indicator:<br />
E5: Biodiversity and ecosystem ser vices<br />
Description<br />
Qualitatively describe how the company<br />
addresses management of risks and oppor tunities<br />
related to biodiversity and/or ecosystem ser vices.<br />
Purpose<br />
Oil industry activities can impact biodiversity and<br />
ecosystem services. They can also depend on<br />
ecosystem services such as fresh water. This<br />
indicator encourages companies to describe their<br />
approach to assessing and managing such<br />
impacts and dependencies. The associated risks<br />
and opportunities vary geographically and with<br />
the type of activity/operation being conducted.<br />
Consequently, the materiality of issues and<br />
aspects associated with reporting of this indicator<br />
varies significantly between companies.<br />
Scope<br />
Using narrative based on policy statements,<br />
commitments, practices and case studies,<br />
companies should describe their goals, ef forts<br />
and outcomes with regard to conser vation of<br />
biodiversity and/or ecosystem services.<br />
Because reporting of this indicator varies widely<br />
across the industry depending on activities and<br />
their locations, the majority of repor ting elements<br />
are supplemental, and provide coverage on:<br />
● How biodiversity and/or ecosystem ser vice<br />
considerations are incorporated into<br />
environmental management systems (EMS) or<br />
health, safety and environment integrated<br />
management systems (HSE IMS). Examples at<br />
business unit or asset level may be useful to<br />
illustrate how the company addresses<br />
assessment and management of biodiversity<br />
and ecosystem services risks and opportunities<br />
related to the terrestrial, fresh water and marine<br />
environment and local communities.<br />
● The percentage of operations where action<br />
plans—stand-alone or integrated into other<br />
action plans—have been implemented in areas<br />
determined by the company to have biodiversity<br />
or ecosystem service risks. The basis or criteria<br />
for the associated sensitivity determination<br />
should be included, and should consider<br />
primary, secondary and/or cumulative impacts.<br />
Companies can describe the results of the plans,<br />
including successful outcomes and how<br />
continuing challenges are being addressed.<br />
48
OIL AND GAS INDUSTRY GUIDANCE ON VOLUNTARY SUSTAINABILITY REPORTING<br />
<strong>Environmental</strong> <strong>indicators</strong> Ecosystem ser vices E5: Biodiversity and ecosystem ser vices<br />
●<br />
●<br />
●<br />
Report on local engagement by explaining<br />
how community and stakeholder concerns are<br />
assessed, evaluated as a measure of<br />
environmental sensitivity, documented and<br />
addressed in biodiversity conservation/action<br />
planning.<br />
Provide examples or case studies of operating<br />
areas where adaptive management of<br />
impacts on biodiversity and/or ecosystem<br />
services is in place. Such examples may<br />
demonstrate the application of company-wide<br />
adaptive management processes or policies at<br />
the site level.<br />
Companies may demonstrate or present<br />
effectiveness verification processes and/or<br />
actions based on assessment of ongoing results.<br />
Reporting basis<br />
Qualitative information including examples to<br />
illustrate application of the indicator at the local<br />
level. This may be supported by some quantitative<br />
data, which should be consolidated within the<br />
company’s reporting boundary using the<br />
‘operational approach’ (Appendix A).<br />
Section 4: <strong>Environmental</strong> <strong>indicators</strong><br />
Definition of terms<br />
• Adaptive management: the process of measuring, monitoring and repor ting the results of current<br />
management practices and using those results to modify management and operational practices to<br />
improve future biodiversity performance.<br />
• Biodiversity: the variability among living organisms within species, between species and between<br />
ecosystems.<br />
• Ecosystem services: the Millennium Ecosystem Assessment [Millennium Ecosystem Assessment,<br />
2005 Ecosystems and Human Well-being. World Resources Institute, Island Press, Washington DC.]<br />
defines ecosystem services as the benefits (direct and indirect) that people obtain from ecosystems.<br />
The Assessment defines four categories of ecosystem ser vices: provisioning services (products<br />
obtained from ecosystems such as fresh water or timber); regulating services (ecosystems’ control of<br />
natural processes such as climate, disease, water flows and pollination); cultural services<br />
(recreation, aesthetic enjoyment); and supporting services (natural processes such as nutrient<br />
cycling that maintain other ser vices).<br />
• Ecosystems: complexes of plant, animal, and micro-organism communities and their non-living<br />
environment, interacting as a functional unit. They include, but are not limited to, wetlands,<br />
rainforests, grasslands and farmlands.<br />
• Operating area: an area where business activities take place with potential to interact with the<br />
adjacent environment. Geographically, the term ’operating area‘ may encompass an area of any<br />
size with a unifying environmental and/or operating feature (e.g. platfor m, field, watershed,<br />
habitat).<br />
49
<strong>IPIECA</strong> • API • OGP<br />
<strong>Environmental</strong> <strong>indicators</strong> Ecosystem ser vices E5: Biodiversity and ecosystem ser vices<br />
Section 4: <strong>Environmental</strong> <strong>indicators</strong><br />
Reporting elements<br />
Common reporting elements<br />
●<br />
Describe the company’s goals<br />
and efforts in addressing<br />
conservation of biodiversity<br />
and/or ecosystem services.<br />
Supplemental reporting elements<br />
●<br />
●<br />
●<br />
●<br />
●<br />
Describe how management of risks and oppor tunities related<br />
to biodiversity and/or ecosystem ser vices is integrated into<br />
the company’s management systems (EMS or HSE IMS).<br />
The percentage of biodiversity-sensitive operating areas (as<br />
determined by the company) where biodiversity action plans<br />
have been implemented. Include the criteria used to<br />
determine sensitivity.<br />
Explanation of how community and stakeholder concer ns are<br />
assessed, evaluated and addressed.<br />
Examples or case studies of operating areas where adaptive<br />
management of impacts on biodiversity and/or ecosystems is<br />
in place.<br />
Effectiveness verification processes and/or actions based on<br />
assessment of ongoing results (by description or example).<br />
Other reporting elements<br />
●<br />
Companies applying an ecosystem ser vices approach may include a description of the company’s<br />
approach to and implementation of broader issues related to resources and processes that are<br />
supplied by natural ecosystems.<br />
References<br />
1. Energy and Biodiversity Initiative (EBI) guidelines and products (2003). www.theebi.org<br />
2. <strong>IPIECA</strong>. 2007. An Ecosystem Approach to Oil and Gas Industr y Biodiversity Conservation.<br />
www.ipieca.org/publication/ecosystem-approach-oil-and-gas-industry-biodiversity-conservation<br />
3. <strong>IPIECA</strong>/OGP. 2005. A Guide to Developing Biodiversity Action Plans for the Oil and Gas Sector .<br />
www.ipieca.org/publication/guide-developing-biodiversity-action-plans-oil-and-gas-sector<br />
4. ISO. <strong>Environmental</strong> Management Systems (ISO 14001 2004), especially section 4.3.1.<br />
www.iso.org/iso/iso_catalogue/catalogue_tc/catalogue_detail.htm?csnumber=31807<br />
5. WBCSD, Meridian Institute, World Resources Institute. 2008. Corporate Ecosystem Services Review: Guidelines for Identifying<br />
Business Risks and Opportunities Arising from Ecosystem Change Version 1.0 (March 2008).<br />
www.wbcsd.org/Plugins/DocSearch/details.asp?DocTypeId=25&ObjectId=Mjg5NjQ<br />
50
OIL AND GAS INDUSTRY GUIDANCE ON VOLUNTARY SUSTAINABILITY REPORTING<br />
<strong>Environmental</strong> <strong>indicators</strong> Ecosystem ser vices E6: Fresh water<br />
Indicator:<br />
E6: Fresh water<br />
Description<br />
Report quantity of fresh water withdrawn or<br />
consumed by oil and gas operations.<br />
Purpose<br />
Fresh water management is important wherever<br />
fresh water resources are constrained due to<br />
limited supplies or extensive use. Water<br />
management can influence water availability for<br />
the local environment, socio-economic<br />
development and future demands.<br />
Scope<br />
The common reporting element recommends<br />
reporting the total volume of fresh water<br />
withdrawn by a company either directly from<br />
fresh water sources (e.g. lakes, ponds,<br />
groundwater aquifers, streams and rivers) or<br />
taken from municipal fresh water supplies or other<br />
water utilities. Some business operations may<br />
return significant amounts of fresh water, treated<br />
as necessary to the appropriate fresh water<br />
standards, back to the same, or to a dif ferent,<br />
fresh water source. The common element also<br />
provides the option of reporting fresh water<br />
consumed (Figure 6), which is the amount of fresh<br />
water withdrawn less fresh water returned. The<br />
common reporting element recognizes that<br />
companies may initially collect and repor t fresh<br />
water withdrawn data and encourages companies<br />
to extend the data collection to enable calculation<br />
of fresh water consumption. Companies are<br />
encouraged to report both fresh water withdrawn<br />
and consumed, subject to the availability of the<br />
required data, as this gives a more complete<br />
picture of sustainability performance trends.<br />
The following types of water should be excluded<br />
from the reported quantities:<br />
● fresh water, used for once-through cooling<br />
water, returned unchanged (excluding thermal<br />
effects) to a fresh water source. (The large<br />
volumes often used in cooling would other wise<br />
distort fresh water withdrawal data and such<br />
use does not represent consumption as the<br />
water is returned. Fresh water used for oncethrough<br />
cooling water is addressed in other<br />
reporting elements.);<br />
● water provided from another facility within the<br />
company, which has already been counted by<br />
that facility;<br />
● storm water; and<br />
Section 4: <strong>Environmental</strong> <strong>indicators</strong><br />
Figure 6 Calculation of fresh water consumption<br />
Fresh water withdrawn (Q1) *<br />
• Purchased potable water<br />
• Purchased raw water<br />
• Groundwater<br />
• Surface water<br />
• Purchased steam<br />
• Purchased other<br />
• Harvested rainwater<br />
• Recycle from external source<br />
Operational use<br />
including<br />
internal recycle<br />
Fresh water consumed = Q1 – Q2<br />
Fresh water returned (Q2)<br />
Fresh wastewater returned to a<br />
fresh water source directly by<br />
the company or indirectly via<br />
a third-party treatment facility<br />
* Note exclusions in the main text, above<br />
51
<strong>IPIECA</strong> • API • OGP<br />
<strong>Environmental</strong> <strong>indicators</strong> Ecosystem ser vices E6: Fresh water<br />
Section 4: <strong>Environmental</strong> <strong>indicators</strong><br />
● fresh groundwater extracted solely for<br />
remediation or to control the migration of<br />
contaminated groundwater.<br />
For upstream operations, produced water is also<br />
generally excluded except where the water meets<br />
regulatory standards for fresh water.<br />
As potential impacts are likely to be localized and<br />
more significant in areas where water is scarce, a<br />
supplemental reporting element encourages<br />
companies to provide additional information on<br />
operations in such locations. Case studies, or<br />
other forms of local reporting, can be used to<br />
illustrate the company’s approach to impact<br />
assessment and conservation of fresh water<br />
resources (see the example on Working in remote<br />
locations in Section 2).<br />
Reporting basis<br />
Volume of fresh water in cubic metres (m 3 ). Fresh<br />
water data should be consolidated within the<br />
company’s reporting boundary using the<br />
‘operational approach’ (Appendix A) and include<br />
examples to illustrate application of the indicator<br />
at the local level.<br />
Definition of terms<br />
• Fresh water: the definition varies in accordance with local statutes and regulations. Where it is not<br />
defined by local regulations, fresh water is defined for repor ting purposes as non-brackish water<br />
and may include drinking water, potable water, water used in agriculture, etc. The total dissolved<br />
solids (TDS) concentration of this water type is up to 2000 mg/l.<br />
• Fresh water withdrawn: the volume of fresh water removed from sources (including sur face water,<br />
groundwater, harvested rainwater and municipal water supplies) and taken into the boundaries of<br />
the reporting company for use.<br />
• Fresh water returned: the amount of fresh water discharged from a facility (directly or via a third<br />
party) into a fresh water supply, body or aquifer. Care must be taken to correct the discharge value<br />
by subtracting the amount of water which was not originally par t of the fresh water withdrawn.<br />
Examples include collected storm water, or any groundwater from remediation activities (unless<br />
used in the facility as a source of fresh water). Fresh water that is discharged to a non-fresh water<br />
supply, body or aquifer should not be considered fresh water retur ned.<br />
• Fresh water consumption: the difference between fresh water withdrawn and fresh water retur ned.<br />
• Water reuse/recycle: the volume of water used in more than one process, or reused more than one<br />
time in a single process, that reduces the total amount of fresh water withdrawal required at the<br />
site. This volume is the dif ference between the total quantity of fresh water required in all processes<br />
(excluding once-through cooling) and the quantity of fresh water withdrawn.<br />
52
OIL AND GAS INDUSTRY GUIDANCE ON VOLUNTARY SUSTAINABILITY REPORTING<br />
<strong>Environmental</strong> <strong>indicators</strong> Ecosystem ser vices E6: Fresh water<br />
Section 4: <strong>Environmental</strong> <strong>indicators</strong><br />
Reporting elements<br />
Common reporting elements<br />
●<br />
Report total fresh water<br />
withdrawn or consumed.<br />
Supplemental reporting elements<br />
●<br />
Identify operations in water-scarce areas and discuss water<br />
management practices.<br />
Other reporting elements<br />
● Information in water-scarce areas including volumes of water withdrawn and/or consumed from<br />
sources such as:<br />
• municipal water supplies or other water utilities;<br />
• surface water, including water from lakes, ponds, streams and rivers; and<br />
• groundwater.<br />
● Examples where companies have avoided or minimized their fresh water withdrawal and/or<br />
consumption in water-scarce areas (e.g. by applying lower water-use technologies, using alter nate<br />
lower-quality sources, or recycle, re-use, reclaim and/or treatment processes).<br />
● Fresh water use for once-through cooling water.<br />
● Information on company use of reused/recycled water.<br />
● Information on company use of fresh groundwater extracted for remediation or to control the<br />
migration of contaminated groundwater.<br />
References<br />
1. FAO (Food and Agriculture Organization of the United Nations). www.fao.org/nr/water/index.html<br />
2. US Geological Survey. water.usgs.gov<br />
3. WHO (World Health Organization). www.who.int/topics/water/en<br />
4. WRI/WBCSD. Global Water Tool.<br />
www.wbcsd.org/templates/TemplateWBCSD5/layout.asp?type=p&MenuId=MTc1Mg&doOpen=1&ClickMenu=LeftMenu<br />
53
<strong>IPIECA</strong> • API • OGP<br />
<strong>Environmental</strong> <strong>indicators</strong><br />
Local environmental impact<br />
Section 4: <strong>Environmental</strong> <strong>indicators</strong><br />
Introducing the issue:<br />
Local environmental impact<br />
The operations of the industr y—exploration,<br />
production, refining, marketing and transport of<br />
oil and gas—can result in impacts on the local<br />
environment. As a result, companies apply<br />
systematic tools to:<br />
● assess environmental impacts;<br />
● mitigate risks of pollution or contamination<br />
through control technologies;<br />
● continuously reduce the impact of emissions,<br />
discharges and waste streams; and<br />
● respond effectively to incidents, such as marine<br />
spills.<br />
This has also resulted in improved and more<br />
consistent <strong>indicators</strong>, which have benefited from<br />
industry benchmarking. The application of a<br />
robust environmental management system (EMS)<br />
and performance <strong>indicators</strong> enables the industr y<br />
to demonstrate continuous improvement in<br />
reducing its impacts on the environment.<br />
Issues relating to the local environment can be<br />
material for corporate reporting. The four<br />
<strong>indicators</strong> in this section focus on impacts to air,<br />
water and land, while recognizing that other<br />
<strong>indicators</strong> previously covered, such as flared gas,<br />
biodiversity and fresh water, can also be significant<br />
in terms of impact to the local environment.<br />
Because these environmental impacts are<br />
localized, the challenges will not be the same<br />
across a company’s operating areas. Regulation of<br />
the local environment is fairly mature in some local<br />
and national jurisdictions, but is less so in others.<br />
Therefore, companies should select reporting<br />
elements through which they can describe their<br />
responses to the challenges they face in dif ferent<br />
areas. Qualitative information can be useful here,<br />
such as case studies, other for ms of local<br />
reporting, or quantitative data that reflects aspects<br />
or sensitivities related to specific locations.<br />
54
OIL AND GAS INDUSTRY GUIDANCE ON VOLUNTARY SUSTAINABILITY REPORTING<br />
<strong>Environmental</strong> <strong>indicators</strong> Local environmental impact E7: Other air emissions<br />
Indicator:<br />
E7: Other air emissions<br />
Description<br />
Report quantities of emissions to the atmosphere<br />
from oil and gas operations.<br />
Purpose<br />
Air emissions from oil and natural gas operations<br />
may contribute to local or regional impacts—such<br />
as regional haze or acid rain—that can af fect<br />
human health or damage flora and fauna.<br />
Reduction in air emissions by industr y can<br />
contribute to improvements in air quality.<br />
Section 4: <strong>Environmental</strong> <strong>indicators</strong><br />
Scope<br />
Significant emissions released to the atmosphere<br />
from oil and natural gas operations should be<br />
reported by emissions type. The specific substances<br />
included in each emission type are detailed in the<br />
definition of terms or as specified by the local<br />
regulatory agency. Substances include:<br />
● volatile organic compounds (VOCs);<br />
● oxides of sulphur (SO x<br />
);<br />
● oxides of nitrogen (NO x<br />
), excluding N 2<br />
O;<br />
● particulate matter (PM);<br />
● ozone-depleting substances (ODS); and<br />
● other regulated air emissions.<br />
This scope does not include CO 2<br />
and methane,<br />
which are reported within indicator E1, GHG<br />
emissions.<br />
Approved or required methods of estimation and<br />
calculation of air emissions var y by local<br />
regulatory standards and by facility per mit<br />
requirements. The performance data for this<br />
indicator should reflect the approved local<br />
methodologies under which the company’s<br />
facilities are operating.<br />
Reporting basis<br />
Report quantitative emission data in metric tonnes<br />
(SO x<br />
reported as SO 2<br />
and NO x<br />
reported as<br />
NO 2<br />
). Air emissions data should be consolidated<br />
within the company’s reporting boundary using<br />
the ‘operational approach’ (Appendix A) and<br />
include examples to illustrate application of the<br />
indicator at the local level.<br />
55
<strong>IPIECA</strong> • API • OGP<br />
<strong>Environmental</strong> <strong>indicators</strong> Local environmental impact E7: Other air emissions<br />
Section 4: <strong>Environmental</strong> <strong>indicators</strong><br />
Definition of terms<br />
Due to air pollution regulations at national, regional and local levels, the specific compounds<br />
regulated in each emission type may var y slightly between jurisdictions. Therefore, the following<br />
definitions are provided as a guide for repor ting:<br />
• Oxides of nitrogen (NO x<br />
): includes nitric oxide (NO) and nitrogen dioxide (NO 2<br />
).<br />
• Oxides of sulphur (SO x<br />
): includes sulphur dioxide (SO 2<br />
) and sulphur trioxide (SO 3<br />
).<br />
• Volatile organic compounds (VOCs): organic compounds, excluding methane, which vaporize in<br />
the atmosphere and may participate in photochemical reactions. VOCs should be defined in<br />
accordance with regulatory requirements where a local regulator y agency has defined measures<br />
for specific compounds. The company should specify which species are included in the repor ting<br />
(e.g. non-methane VOC, non-methane-ethane VOC) and qualify if there are locations where a<br />
local regulatory agency has defined specific compounds.<br />
• Particulate matter (PM): a complex mixture of extremely small par ticles and liquid droplets. PM is<br />
made up of a number of components, including acids (such as nitrates and sulphates), organic<br />
chemicals, metals, and soil or dust par ticles. Definitions depend on local regulations and are<br />
frequently based on particle size (e.g. PM 10<br />
or PM 2.5<br />
). Companies should specify which PM metric<br />
they are reporting.<br />
• Ozone-depleting substances: includes halons, CFCs, HCFCs and methyl bromide (repor ting<br />
suggested where quantities emitted may be of interest).<br />
Reporting elements<br />
Common reporting elements<br />
Supplemental reporting elements<br />
●<br />
Report total emissions, by type:<br />
• volatile organic compounds (VOCs);<br />
• oxides of sulphur (SO x<br />
); and/or<br />
• oxides of nitrogen (NO x<br />
).<br />
● Total emissions, by type, if significant:<br />
• particulate matter (PM);<br />
• ozone-depleting substances (ODS); and/or<br />
• other air emissions with a company-wide impact.<br />
● Regional and/or business activity breakdown,<br />
where relevant.<br />
Other reporting elements<br />
● Companies are encouraged to report case studies, or other for ms of local reporting or data that<br />
address significant impacts at regional, national and/or local levels.<br />
● Identify operations in areas of poor air quality and discuss air management practices.<br />
References<br />
1. CONCAWE. 2009. Air Pollutant Emission Estimating Methods for E-PRTR Reporting by Refineries. Report 1/09.<br />
www.concawe.be/content/default.asp?PageID=569<br />
2. US EPA AP-42 standards, www.epa.gov/ttn/chief/ap42/index.html; or the EMEP/EEA Emission Inventory Guidebook.<br />
www.eea.europa.eu/publications/emep-eea-emission-inventory-guidebook-2009<br />
56
OIL AND GAS INDUSTRY GUIDANCE ON VOLUNTARY SUSTAINABILITY REPORTING<br />
<strong>Environmental</strong> <strong>indicators</strong> Local environmental impact E8: Spills to the environment<br />
Indicator:<br />
E8: Spills to the environment<br />
Description<br />
Quantify spills to the environment from<br />
operations, and describe major spills and<br />
response measures.<br />
Purpose<br />
The oil industry transports oil and gas using<br />
pipelines and marine or road tankers. These<br />
operations, together with other upstream and<br />
downstream activities, pose a risk of accidental<br />
spills of oil or other materials that have the potential<br />
to pollute water, contaminate soil, harm species<br />
and affect livelihoods. This indicator measures the<br />
number and volume of spills (unintended releases)<br />
of materials that could impact the environment.<br />
Scope<br />
The most established industry measure is to report<br />
the number and volume of hydrocarbon spills<br />
greater than one barrel (bbl) that reach the<br />
environment. (For reference, 1 bbl = 42 US<br />
gallons or 159 litres; for solids, conver t mass to<br />
volume in barrels, for example, using 159 kg or<br />
similar default value for weight of material.) The<br />
volume reported should represent the total<br />
estimated amount spilled that reached the<br />
environment. It should not be reduced by the<br />
amount of such hydrocarbon subsequently<br />
recovered, evaporated or otherwise lost.<br />
further reporting on operational performance and<br />
reliability.<br />
Companies should include releases from<br />
operations and events including:<br />
● above-ground and below-ground facilities;<br />
● sabotage, earthquakes or other events outside<br />
operational control; and<br />
● company-owned and operated transport.<br />
Leakage over time, above ground or underground,<br />
is counted once at the time it is identified.<br />
Companies may report spills to soil and water<br />
separately. A spill that qualifies as a spill to both<br />
soil and water should be repor ted as a single spill<br />
to water, with the volume properly appor tioned to<br />
soil and water.<br />
The following should be excluded from the<br />
reported data:<br />
● once previously reported, spilled materials in<br />
the environment from historical losses (i.e.<br />
historical or past leakage/spills that reached<br />
the environment from tanks, pipes or other<br />
vessels, but not associated with a current<br />
release); and<br />
● hydrocarbons in produced water discharges or<br />
otherwise permitted discharges (i.e.<br />
wastewater effluents etc.), which are included<br />
in indicator E9, Discharges to water.<br />
Section 4: <strong>Environmental</strong> <strong>indicators</strong><br />
In addition to reporting spills that reach the<br />
environment, companies may choose to repor t<br />
separately the number and volume of spills,<br />
whether or not the spill reached the environment.<br />
Thus, total spills would include releases—<br />
hydrocarbon and/or chemicals—from primary<br />
containment (i.e. spills that reach the environment,<br />
plus spills that are contained within imper meable<br />
secondary containment). This indicator provides<br />
In the absence of analytical data, repor ting<br />
companies may choose to estimate the<br />
hydrocarbon content of spills of oil/water<br />
mixtures (e.g. oil–water emulsions, tank bottoms),<br />
stating the scope or basis of the estimate. If<br />
reporting spills with both hydrocarbon and nonhydrocarbon<br />
components, companies may wish<br />
to report a single hydrocarbon spill with the<br />
volumes properly apportioned.<br />
57
<strong>IPIECA</strong> • API • OGP<br />
<strong>Environmental</strong> <strong>indicators</strong> Local environmental impact E8: Spills to the environment<br />
Section 4: <strong>Environmental</strong> <strong>indicators</strong><br />
If relevant, companies may choose to repor t<br />
separately spills of other materials, including<br />
chemicals. For chemical spills involving:<br />
● miscible solutions, the spill volume is based on<br />
the total volume of material spilled; and<br />
● insoluble mixtures, the spill volume is based on<br />
the volume of the chemical constituent.<br />
Reporting basis<br />
Number of spills greater than one barrel (or<br />
0.159 cubic metres) and the volume of these spills<br />
in barrels (bbl) or cubic metres of material spilled.<br />
Oil spill data should be consolidated within the<br />
company’s reporting boundary using the<br />
‘operational approach’ (Appendix A) and include<br />
examples to illustrate application of the indicator<br />
at the local level.<br />
Definition of terms<br />
• Spill to the environment: any unintended release of liquids or solids associated with current operations, from primar y<br />
or secondary containment, into the environment.<br />
• Environment: surface water, soil and groundwater in soil whereby:<br />
- ’soil‘ is surfaces (e.g. soil, sand, silts, shells, gravel) not designated as imper meable secondary containment;<br />
- ‘surface water’ includes creeks, rivers, ponds, seas, oceans, etc. but excludes ponds, pits, basins, etc. in place on<br />
company property for purposes of hydrocarbon containment/treatment;<br />
- spills to ice-covered surfaces are classified based on the sur face below the ice; and<br />
- spills to standing rainwater are classified as a spill to soil.<br />
• Hydrocarbon liquids: crude oil, condensate and petroleum-related products containing hydrocarbons that are used or<br />
manufactured, such as: gasoline, residuals, distillates, asphalt, jet fuel, lubricants, naphthas, light ends, bilge oil,<br />
kerosene, aromatics, refinery petroleum-derivatives. Includes:<br />
- biofuels, regardless of percentage mixture with petroleum-based materials (if 100% methanol or ethanol it would be<br />
a chemical spill); and<br />
- the oil fraction of oil/water mixtures (e.g. emulsions, non-aqueous drilling fluids (NADFs)).<br />
• Non-hydrocarbon materials: materials such as chemicals, aqueous-based drilling fluids, produced water and other<br />
process-related non-hydrocarbons. Examples of chemicals include methanol, ethanol, ketones, methyl ter tiary butyl ether<br />
(MTBE), sulphuric acid, caustic, molten sulphur, stimulation acid, brine, dr y salts, uncured or powdered cement.<br />
Excluded are spills of inert solid materials such as plastic pellets, solid sulphur, barium sulphate, bentonite or cured solid<br />
concrete as well as treated or untreated wastewater.<br />
• Containment: primary containment is the vessel, pipe, barrel etc. designed to keep a material within it; secondar y<br />
containment is an impermeable, non-leaking physical barrier specifically designed and maintained to keep spilled<br />
materials from contacting the soil or water (e.g. HDPE liners, engineered clay liners, asphalt, concrete). Ear then berms<br />
do not count as secondar y containment unless they are engineered to be suf ficiently impermeable to prevent spilled oil<br />
from contaminating underlying soil and/or groundwater.<br />
• Recovered hydrocarbons: the spilled hydrocarbons removed from the environment through shor t-term spill response<br />
activities. This does not include longer-term remediation of the spill site. Oil which evaporates or bur ns should not be included<br />
in recovered volumes. This volume provides an indication of the ef fectiveness of immediate oil spill response measures.<br />
58
OIL AND GAS INDUSTRY GUIDANCE ON VOLUNTARY SUSTAINABILITY REPORTING<br />
<strong>Environmental</strong> <strong>indicators</strong> Local environmental impact E8: Spills to the environment<br />
Section 4: <strong>Environmental</strong> <strong>indicators</strong><br />
Reporting elements<br />
Common reporting elements<br />
●<br />
●<br />
●<br />
Report the number and total volume spilled of<br />
hydrocarbon spills > 1 bbl reaching the<br />
environment.<br />
For spills of significance, determined by the<br />
company, describe impacts and response actions.<br />
Describe emergency preparedness and response<br />
programmes, plans, organizational structures<br />
and affiliations for an effective response to spills<br />
and other emergencies.<br />
Supplemental reporting elements<br />
● Volume of hydrocarbon recovered.<br />
● Total number and volume spilled (bbls) of<br />
hydrocarbon spills > 1 bbl from primar y<br />
containment.<br />
● Separately report hydrocarbon spills to soil<br />
and to water (number and volume spilled).<br />
● Separately report hydrocarbon spills by<br />
business activity (e.g. exploration and<br />
production, refining, chemicals).<br />
Other reporting elements<br />
● Report spills of chemicals or other materials (non-hydrocarbon) that could have an impact on the<br />
environment.<br />
● Separately report land and water spill data for spills that reach the environment.<br />
● Report spills with lower thresholds (
<strong>IPIECA</strong> • API • OGP<br />
<strong>Environmental</strong> <strong>indicators</strong> Local environmental impact E9: Discharges to water<br />
Section 4: <strong>Environmental</strong> <strong>indicators</strong><br />
Indicator:<br />
E9: Discharges to water<br />
Description<br />
Quantify hydrocarbon discharges to a water<br />
environment from oil and gas operations.<br />
Purpose<br />
Discharges to water are controlled industr y-wide<br />
to reduce environmental impacts. The oil and gas<br />
industry handles large quantities of produced<br />
water, process wastewater and storm water<br />
which, in compliance with regulator y<br />
requirements, are normally treated to remove<br />
contaminants before being discharged. Actual<br />
environmental risk or impact is subject to local<br />
environmental conditions: larger discharges in<br />
some environments may have lower risk than<br />
smaller discharges in other environments.<br />
Scope<br />
For exploration and production operations, this<br />
indicator refers to the quantity of hydrocarbons<br />
discharged in produced water, process<br />
wastewater and storm water. For refining and<br />
other oil and gas processing facilities, it refers to<br />
the quantity of hydrocarbons in discharged<br />
process wastewater and storm water. Inland<br />
discharges to drainage structures that connect<br />
waterways are included and quantities of other<br />
substances, in process wastewater and storm<br />
water, discharged to water may be repor ted.<br />
This indicator excludes:<br />
● spills, including hydrocarbons, chemicals<br />
and/or oil-based drilling fluids and cuttings<br />
●<br />
●<br />
●<br />
(included under E8, Spills to the environment);<br />
spills of drilling and production chemicals<br />
(included under E8, Spills to the environment);<br />
quantities of hydrocarbon discharged to thirdparty<br />
treatment facilities; and<br />
quantities of hydrocarbon associated with a<br />
once-through cooling water withdrawal<br />
returned unchanged, excluding thermal effects.<br />
Reporting basis<br />
Report discharge data in metric tonnes of<br />
hydrocarbons (oil and grease) or other<br />
substances reported. Quantities may also be<br />
expressed in terms of average concentrations<br />
(in mg/l or ppm).<br />
Water discharge data should be consolidated<br />
using the reporting boundary ‘operational<br />
approach’ (Appendix A) and include examples<br />
to illustrate application of the indicator at the<br />
local level.<br />
Measurements should be made using test methods<br />
required or approved by local regulator y<br />
authorities (or equivalent applicable standards).<br />
Definition of terms<br />
• Produced water: water that is brought to the sur face during the production of hydrocarbons.<br />
• Process wastewater: water associated with operations that comes into contact with hydrocarbons<br />
and other chemicals.<br />
• Storm water: rainwater falling on a site that is collected and discharged to the water environment<br />
from point source outlets (e.g. pipes, collection ditches).<br />
• Discharges to the environment: includes both inland waterways and the sea.<br />
60
OIL AND GAS INDUSTRY GUIDANCE ON VOLUNTARY SUSTAINABILITY REPORTING<br />
<strong>Environmental</strong> <strong>indicators</strong> Local environmental impact E9: Discharges to water<br />
Reporting elements<br />
Common reporting elements<br />
●<br />
●<br />
For upstream facilities, report quantity of<br />
hydrocarbons (in metric tonnes) in produced<br />
water, process wastewater and storm water<br />
discharged to surface water.<br />
For refineries and other oil and gas<br />
processing facilities, report quantity of<br />
hydrocarbons (in metric tonnes) discharged<br />
to surface water from treated process<br />
wastewater and storm water.<br />
Supplemental reporting elements<br />
●<br />
Report separately the quantity of substances<br />
other than hydrocarbons (in metric tonnes)<br />
discharged to surface water from oil and gas<br />
processing facilities. Other measures may<br />
include chemical oxygen demand (COD),<br />
sulphides, ammonia, phenols, and total<br />
suspended solids (TSS), as well as non-aqueous<br />
drilling fluids discharged (i.e. in association<br />
with drilling mud and drill cuttings).<br />
Section 4: <strong>Environmental</strong> <strong>indicators</strong><br />
Other reporting elements<br />
● Report separately the quantities of substances in stor m water or other non-process wastewater<br />
discharges.<br />
● Indicate volumes of produced water, process wastewater and storm water discharged, and detail the<br />
treatment method, place of discharge and volumes reused by others.<br />
● Explain trends in discharged volumes with respect to operating conditions af fected by field age, etc.<br />
● Discuss efforts to reduce discharges into environments where they have greater potential for causing<br />
environmental impacts.<br />
● Discuss discharges to unlined evaporation ponds that may af fect groundwater, if material.<br />
61
<strong>IPIECA</strong> • API • OGP<br />
<strong>Environmental</strong> <strong>indicators</strong> Local environmental impact E10: W aste<br />
Section 4: <strong>Environmental</strong> <strong>indicators</strong><br />
Indicator:<br />
E10: Waste<br />
Description<br />
Report quantities of waste disposed of, resulting<br />
from oil and gas operations.<br />
Purpose<br />
Effective waste management practices are<br />
important throughout operations to reduce the<br />
environmental, social or economic impacts.<br />
Waste is not defined consistently worldwide and<br />
its management often varies with local<br />
conditions. This indicator recognizes that an<br />
important way of reducing waste impacts is to<br />
minimize the generation of waste, and that<br />
effective waste management is an aspect of<br />
operational efficiency.<br />
Scope<br />
Report the quantity of operational hazardous<br />
waste disposed of, including both on-site and of f-<br />
site disposal. Companies may wish to repor t<br />
separately the quantities of operational nonhazardous<br />
waste disposed of, and of waste<br />
reused, recycled or recovered. The company<br />
should clearly state the basis for its repor ted data.<br />
Sources that should be included are:<br />
● wastes from operational activities;<br />
● wastes from spill response/clean-up; and<br />
● wastes from replacement or upgrade of<br />
existing facilities (e.g. during the rebuilding of<br />
a retail service station).<br />
Excluded from the scope are:<br />
● wastes from the remediation of historical<br />
contamination at active sites;<br />
● wastes from the remediation of inactive or<br />
abandoned properties;<br />
● wastes from the construction of new facilities<br />
upon greenfield sites;<br />
● wastes generated by contractors during<br />
maintenance of their own equipment, or any<br />
materials brought onto site and eventually<br />
disposed of as surplus by the contractor;<br />
● drilling mud and cuttings;<br />
● mine tailings; and<br />
● produced water and waste water.<br />
If a regulatory authority defines any of these outof-scope<br />
materials as hazardous—or some<br />
equivalent term—and they are disposed of as<br />
defined above, they should be repor ted<br />
accordingly as operational hazardous waste.<br />
Different types of business or operational activity<br />
can have different regulated hazardous waste<br />
streams, with different treatment and management<br />
options available depending upon the regions in<br />
the world in which the repor ting company<br />
operates.<br />
In downstream operations, major shutdowns and<br />
periodic maintenance activities can result in shor t-<br />
term increases in waste generated. For upstream<br />
operations, high-volume, short-term aqueous<br />
wastes (such as those associated with drilling) can<br />
result in large variations in waste generated.<br />
Reporting these waste streams separately may<br />
enable companies to better understand and<br />
explain year-to-year fluctuations. The scope of<br />
waste streams included should be clearly stated.<br />
In areas of the world where no waste<br />
infrastructure exists, waste may need to be safely<br />
stored on site for a significant period of time<br />
before final disposal or a recover y option can<br />
take place. Companies should report separately<br />
the quantity of waste in such storage if the<br />
amount is material to the overall company total.<br />
Similarly, they should explain the inclusion of<br />
large one-off disposals of stored waste in their<br />
reported numbers.<br />
62
OIL AND GAS INDUSTRY GUIDANCE ON VOLUNTARY SUSTAINABILITY REPORTING<br />
<strong>Environmental</strong> <strong>indicators</strong> Local environmental impact E10: W aste<br />
Reporting basis<br />
Report mass of waste in metric tonnes. Waste<br />
data should be consolidated within the<br />
company’s reporting boundary using the<br />
‘operational approach’ (Appendix A) and<br />
include examples to illustrate application of the<br />
indicator at the local level.<br />
It may not be practical to account for all waste<br />
from operations. If a company has adopted an<br />
internal de minimis reporting threshold, by which<br />
a facility does not track waste infor mation, it is<br />
good practice to disclose the de minimis threshold<br />
and indicate the significance to the company’s<br />
data—indicating if, for example, routine waste<br />
from marketing operations is below an<br />
established de minimis level.<br />
Quantities of wastes (both hazardous and nonhazardous)<br />
should be measured using methods<br />
required or recommended by regulator y agencies<br />
or authorities. The method of measurement and<br />
estimation selected should be stated.<br />
Recommended methods include:<br />
● direct measurement on site;<br />
● direct measurement by transporters at the point<br />
of shipping or loading (consistent with<br />
shipping papers);<br />
● direct measurement by waste disposal<br />
contractor at the point of waste disposal; and<br />
● engineering estimates or process knowledge.<br />
Section 4: <strong>Environmental</strong> <strong>indicators</strong><br />
Definition of terms<br />
• Waste: material (solid or liquid) intended to be disposed of, reused, recycled or recovered either on<br />
site or off site that is the result of company ope rations. Includes domestic trash and other discarded<br />
material from offices and commercial (e.g. retail) activity. It does not include regulated or authorized<br />
water discharges such as effluent from water treatment plants or produced water from oil and gas<br />
production.<br />
• Operational hazardous waste: waste that is defined as hazardous, toxic, dangerous, listed, priority ,<br />
special—or similar term—per applicable country, regulatory agency or authority.<br />
• Operational non-hazardous waste: industrial wastes resulting from company operations, including<br />
process and oil field wastes (solid and liquid) disposed of either on site or of f site. Includes trash and<br />
other office, commercial (e.g. retail) or packaging-related wastes. Excludes hazardous waste as<br />
defined above.<br />
• Disposal: any waste management option, either on-site or of f-site, classified as ’disposal‘ by an<br />
appropriate regulatory agency or authority, or in cases where such classification is absent, any waste<br />
management that does not meet the definition of ‘reused, recycled and recovered’ wastes (e.g. land<br />
filling or burning without energy recovery). Temporary storage is not considered disposal.<br />
• Reused, recycled or recovered wastes: wastes from an industrial or commercial (e.g. retail) process<br />
that are not disposed of, but are reused (e.g. used as a raw material for another process) or<br />
recovered for beneficial use. Examples may include: catalysts sent for reclamation; sludge used for<br />
fuel; reused construction materials; recovered used oil and solvents; recycled scrap metal; drums and<br />
pallets returned or reused; plastic, glass, or paper reused or reprocessed and uncontaminated<br />
earthen materials used as fill.<br />
63
<strong>IPIECA</strong> • API • OGP<br />
<strong>Environmental</strong> <strong>indicators</strong> Local environmental impact E10: W aste<br />
Section 4: <strong>Environmental</strong> <strong>indicators</strong><br />
Reporting elements<br />
Common reporting elements<br />
●<br />
The total quantity, in metric tonnes, of<br />
operational hazardous waste disposed of.<br />
Supplemental reporting elements<br />
● The total quantity of operational non-hazardous<br />
waste disposed of.<br />
● Waste recycled, reused or recovered.<br />
Other reporting elements<br />
● Report separately quantities of waste by waste streams and by business or operational activities.<br />
● Report separately significant quantities of waste stored on operational sites.<br />
● In addition to reporting operational waste disposed of, companies may wish to also repor t waste<br />
generated, prior to recycle, reuse or recover y measures.<br />
● Report separately wastes excluded from routine repor ting: from remediation activities from either<br />
active and/or inactive sites, waste associated with unusual activities such as large one-time<br />
construction projects, or large-volume wastes such as drill mud and cuttings, or mine tailings.<br />
● Report on efforts to minimize the generation of hazardous wastes and on processes used to verify<br />
that company hazardous waste management practices adhere to regulations and are conducted in a<br />
safe manner.<br />
References<br />
1. European Parliament. Directive 2008/98/EC on Waste. (19 November 2008).<br />
eur-lex.europa.eu/LexUriServ/LexUriServ.do?uri=OJ:L:2008:312:0003:0003:EN:PDF<br />
2. OGP. 2008. Guidelines for waste management with special focus on areas with limited infrastructure . OGP Report No. 413.<br />
(Rev. 1.1 September 2008; updated March 2009). www.ogp.org.uk/pubs/413.pdf<br />
64