LCP Proudreed PLC - Irish Stock Exchange
LCP Proudreed PLC - Irish Stock Exchange
LCP Proudreed PLC - Irish Stock Exchange

Create successful ePaper yourself
Turn your PDF publications into a flip-book with our unique Google optimized e-Paper software.
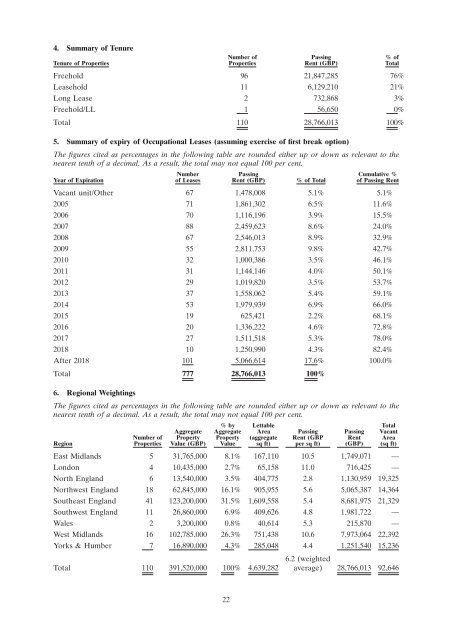
4. Summary of Tenure<br />
Tenure of Properties<br />
Number of<br />
Properties<br />
Passing<br />
Rent (GBP)<br />
% of<br />
Total<br />
Freehold 96 21,847,285 76%<br />
Leasehold 11 6,129,210 21%<br />
Long Lease 2 732,868 3%<br />
Freehold/LL 1 56,650 0%<br />
Total 110 28,766,013 100%<br />
5. Summary of expiry of Occupational Leases (assuming exercise of first break option)<br />
The figures cited as percentages in the following table are rounded either up or down as relevant to the<br />
nearest tenth of a decimal. As a result, the total may not equal 100 per cent.<br />
Year of Expiration<br />
Number<br />
of Leases<br />
Passing<br />
Rent (GBP)<br />
% of Total<br />
Cumulative %<br />
of Passing Rent<br />
Vacant unit/Other 67 1,478,008 5.1% 5.1%<br />
2005 71 1,861,302 6.5% 11.6%<br />
2006 70 1,116,196 3.9% 15.5%<br />
2007 88 2,459,623 8.6% 24.0%<br />
2008 67 2,546,013 8.9% 32.9%<br />
2009 55 2,811,753 9.8% 42.7%<br />
2010 32 1,000,386 3.5% 46.1%<br />
2011 31 1,144,146 4.0% 50.1%<br />
2012 29 1,019,820 3.5% 53.7%<br />
2013 37 1,558,062 5.4% 59.1%<br />
2014 53 1,979,939 6.9% 66.0%<br />
2015 19 625,421 2.2% 68.1%<br />
2016 20 1,336,222 4.6% 72.8%<br />
2017 27 1,511,518 5.3% 78.0%<br />
2018 10 1,250,990 4.3% 82.4%<br />
After 2018 101 5,066,614 17.6% 100.0%<br />
Total 777 28,766,013 100%<br />
6. Regional Weightings<br />
The figures cited as percentages in the following table are rounded either up or down as relevant to the<br />
nearest tenth of a decimal. As a result, the total may not equal 100 per cent.<br />
Region<br />
Number of<br />
Properties<br />
Aggregate<br />
Property<br />
Value (GBP)<br />
% by<br />
Aggregate<br />
Property<br />
Value<br />
Lettable<br />
Area<br />
(aggregate<br />
sq ft)<br />
Passing<br />
Rent (GBP<br />
per sq ft)<br />
Passing<br />
Rent<br />
(GBP)<br />
Total<br />
Vacant<br />
Area<br />
(sq ft)<br />
East Midlands 5 31,765,000 8.1% 167,110 10.5 1,749,071 —<br />
London 4 10,435,000 2.7% 65,158 11.0 716,425 —<br />
North England 6 13,540,000 3.5% 404,775 2.8 1,130,959 19,325<br />
Northwest England 18 62,845,000 16.1% 905,955 5.6 5,065,387 14,364<br />
Southeast England 41 123,200,000 31.5% 1,609,558 5.4 8,681,975 21,329<br />
Southwest England 11 26,860,000 6.9% 409,626 4.8 1,981,722 —<br />
Wales 2 3,200,000 0.8% 40,614 5.3 215,870 —<br />
West Midlands 16 102,785,000 26.3% 751,438 10.6 7,973,064 22,392<br />
Yorks & Humber 7 16,890,000 4.3% 285,048 4.4 1,251,540 15,236<br />
Total 110 391,520,000 100% 4,639,282<br />
6.2 (weighted<br />
average) 28,766,013 92,646<br />
22