

Data integration in microbial genomics ... - Jacobs University
Data integration in microbial genomics ... - Jacobs University
Data integration in microbial genomics ... - Jacobs University

Create successful ePaper yourself
Turn your PDF publications into a flip-book with our unique Google optimized e-Paper software.
6.4. Results 83<br />
employed <strong>in</strong>direct gradient analysis (see [Ramette, 2007] for a review<br />
of multivariate analyses) after [Virtanen et al., 2006] to relate DUF<br />
abundances <strong>in</strong> network II (Fig. 6.1; 17 DUF varieties) to chlorophyll<br />
concentrations at appropriate GOS sites (n=56; see Supplementary<br />
methods onl<strong>in</strong>e). We standardized DUF abundances at each site by<br />
the median abundance of 22 ‘s<strong>in</strong>gle-copy doma<strong>in</strong>s’ detected at that<br />
site.<br />
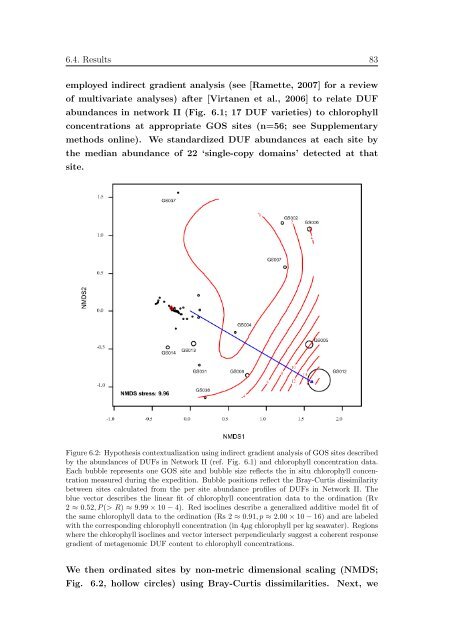
Figure 6.2: Hypothesis contextualization us<strong>in</strong>g <strong>in</strong>direct gradient analysis of GOS sites described<br />
by the abundances of DUFs <strong>in</strong> Network II (ref. Fig. 6.1) and chlorophyll concentration data.<br />
Each bubble represents one GOS site and bubble size reflects the <strong>in</strong> situ chlorophyll concentration<br />
measured dur<strong>in</strong>g the expedition. Bubble positions reflect the Bray-Curtis dissimilarity<br />
between sites calculated from the per site abundance profiles of DUFs <strong>in</strong> Network II. The<br />
blue vector describes the l<strong>in</strong>ear fit of chlorophyll concentration data to the ord<strong>in</strong>ation (Rv<br />
2 ≈ 0.52, P (> R) ≈ 9.99 × 10 − 4). Red isocl<strong>in</strong>es describe a generalized additive model fit of<br />
the same chlorophyll data to the ord<strong>in</strong>ation (Rs 2 ≈ 0.91, p ≈ 2.00 × 10 − 16) and are labeled<br />
with the correspond<strong>in</strong>g chlorophyll concentration (<strong>in</strong> 4µg chlorophyll per kg seawater). Regions<br />
where the chlorophyll isocl<strong>in</strong>es and vector <strong>in</strong>tersect perpendicularly suggest a coherent response<br />
gradient of metagenomic DUF content to chlorophyll concentrations.<br />
We then ord<strong>in</strong>ated sites by non-metric dimensional scal<strong>in</strong>g (NMDS;<br />
Fig. 6.2, hollow circles) us<strong>in</strong>g Bray-Curtis dissimilarities. Next, we


