Part 1 Economic Self Sufficiency 12-17-10.indd - The Coordinating ...
Part 1 Economic Self Sufficiency 12-17-10.indd - The Coordinating ...
Part 1 Economic Self Sufficiency 12-17-10.indd - The Coordinating ...

You also want an ePaper? Increase the reach of your titles
YUMPU automatically turns print PDFs into web optimized ePapers that Google loves.
ECONOMIC SELF-SUFFICIENCY<br />
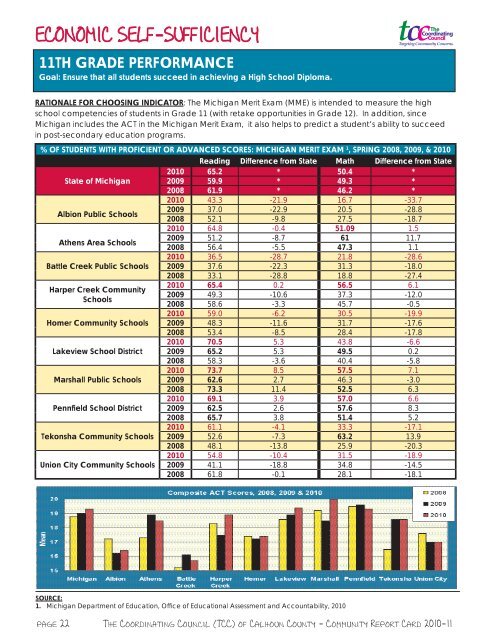
11TH GRADE PERFORMANCE<br />
Goal: Ensure that all students succeed in achieving a High School Diploma.<br />
RATIONALE FOR CHOOSING INDICATOR: <strong>The</strong> Michigan Merit Exam (MME) is intended to measure the high<br />
school competencies of students in Grade 11 (with retake opportunities in Grade <strong>12</strong>). In addition, since<br />
Michigan includes the ACT in the Michigan Merit Exam, it also helps to predict a student’s ability to succeed<br />
in post-secondary education programs.<br />
% OF STUDENTS WITH PROFICIENT OR ADVANCED SCORES: MICHIGAN MERIT EXAM 1 , SPRING 2008, 2009, & 2010<br />
Reading Difference from State Math Difference from State<br />
2010 65.2 * 50.4 *<br />
State of Michigan 2009 59.9 * 49.3 *<br />
2008 61.9 * 46.2 *<br />
2010 43.3 -21.9 16.7 -33.7<br />
Albion Public Schools<br />
2009 37.0 -22.9 20.5 -28.8<br />
2008 52.1 -9.8 27.5 -18.7<br />
2010 64.8 -0.4 51.09 1.5<br />
Athens Area Schools<br />
2009 51.2 -8.7 61 11.7<br />
2008 56.4 -5.5 47.3 1.1<br />
2010 36.5 -28.7 21.8 -28.6<br />
Battle Creek Public Schools 2009 37.6 -22.3 31.3 -18.0<br />
2008 33.1 -28.8 18.8 -27.4<br />
2010 65.4 0.2 56.5 6.1<br />
Harper Creek Community<br />
2009 49.3 -10.6 37.3 -<strong>12</strong>.0<br />
Schools<br />
2008 58.6 -3.3 45.7 -0.5<br />
2010 59.0 -6.2 30.5 -19.9<br />
Homer Community Schools 2009 48.3 -11.6 31.7 -<strong>17</strong>.6<br />
2008 53.4 -8.5 28.4 -<strong>17</strong>.8<br />
2010 70.5 5.3 43.8 -6.6<br />
Lakeview School District 2009 65.2 5.3 49.5 0.2<br />
2008 58.3 -3.6 40.4 -5.8<br />
2010 73.7 8.5 57.5 7.1<br />
Marshall Public Schools 2009 62.6 2.7 46.3 -3.0<br />
2008 73.3 11.4 52.5 6.3<br />
2010 69.1 3.9 57.0 6.6<br />
Pennfield School District 2009 62.5 2.6 57.6 8.3<br />
2008 65.7 3.8 51.4 5.2<br />
2010 61.1 -4.1 33.3 -<strong>17</strong>.1<br />
Tekonsha Community Schools 2009 52.6 -7.3 63.2 13.9<br />
2008 48.1 -13.8 25.9 -20.3<br />
2010 54.8 -10.4 31.5 -18.9<br />
Union City Community Schools 2009 41.1 -18.8 34.8 -14.5<br />
2008 61.8 -0.1 28.1 -18.1<br />
SOURCE:<br />
1. Michigan Department of Education, Offi ce of Educational Assessment and Accountability, 2010<br />
page 22 <strong>The</strong> <strong>Coordinating</strong> Council (TCC) of Calhoun County - Community Report Card 2010-11