The Finnish Property Market 2009 - KTI
The Finnish Property Market 2009 - KTI
The Finnish Property Market 2009 - KTI

Create successful ePaper yourself
Turn your PDF publications into a flip-book with our unique Google optimized e-Paper software.
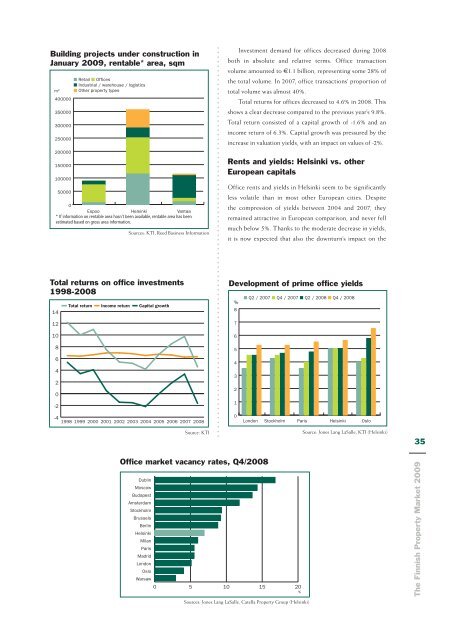
Building projects under construction in<br />
January <strong>2009</strong>, rentable* area, sqm<br />
m 2<br />
400000<br />
350000<br />
300000<br />
250000<br />
200000<br />
150000<br />
100000<br />
50000<br />
■ Retail ■ Offices<br />
■ Industrial / warehouse / logistics<br />
■ Other property types<br />
0<br />
Espoo Helsinki Vantaa<br />
* If information on rentable area hasn’t been available, rentable area has been<br />
estimated based on gross area information.<br />
Sources: <strong>KTI</strong>, Reed Business Information<br />
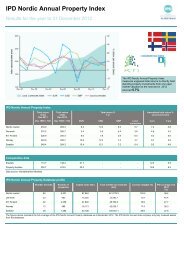
Investment demand for offices decreased during 2008<br />
both in absolute and relative terms. Office transaction<br />
volume amounted to €1.1 billion, representing some 28% of<br />
the total volume. In 2007, office transactions’ proportion of<br />
total volume was almost 40%.<br />
Total returns for offices decreased to 4.6% in 2008. This<br />
shows a clear decrease compared to the previous year’s 9.8%.<br />
Total return consisted of a capital growth of -1.6% and an<br />
income return of 6.3%. Capital growth was pressured by the<br />
increase in valuation yields, with an impact on values of -2%.<br />
Rents and yields: Helsinki vs. other<br />
European capitals<br />
Office rents and yields in Helsinki seem to be significantly<br />
less volatile than in most other European cities. Despite<br />
the compression of yields between 2004 and 2007, they<br />
remained attractive in European comparison, and never fell<br />
much below 5%. Thanks to the moderate decrease in yields,<br />
it is now expected that also the downturn’s impact on the<br />
Total returns on office investments<br />
1998-2008<br />
14<br />
12<br />
10<br />
Total return<br />
Income return<br />
Capital growth<br />
Development of prime office yields<br />
■ Q2 / 2007 ■ Q4 / 2007 ■ Q2 / 2008 ■ Q4 / 2008<br />
%<br />
8<br />
7<br />
6<br />
8<br />
6<br />
4<br />
2<br />
0<br />
-2<br />
-4<br />
1998 1999 2000 2001 2002 2003 2004 2005 2006 2007 2008<br />
5<br />
4<br />
3<br />
2<br />
1<br />
0<br />
London Stockholm Paris Helsinki Oslo<br />
Source: <strong>KTI</strong><br />
Source: Jones Lang LaSalle, <strong>KTI</strong> (Helsinki)<br />
35<br />
Office market vacancy rates, Q4/2008<br />
Dublin<br />
Moscow<br />
Budapest<br />
Amsterdam<br />
Stockholm<br />
Brussels<br />
Berlin<br />
Helsinki<br />
Milan<br />
Paris<br />
Madrid<br />
London<br />
Oslo<br />
Warsaw<br />
0 5 10 15 20<br />
%<br />
<strong>The</strong> <strong>Finnish</strong> <strong>Property</strong> <strong>Market</strong> <strong>2009</strong><br />
Sources: Jones Lang LaSalle, Catella <strong>Property</strong> Group (Helsinki)