CENTRAL JAPAN RAILWAY COMPANY Annual Report 2007
CENTRAL JAPAN RAILWAY COMPANY Annual Report 2007
CENTRAL JAPAN RAILWAY COMPANY Annual Report 2007

Create successful ePaper yourself
Turn your PDF publications into a flip-book with our unique Google optimized e-Paper software.
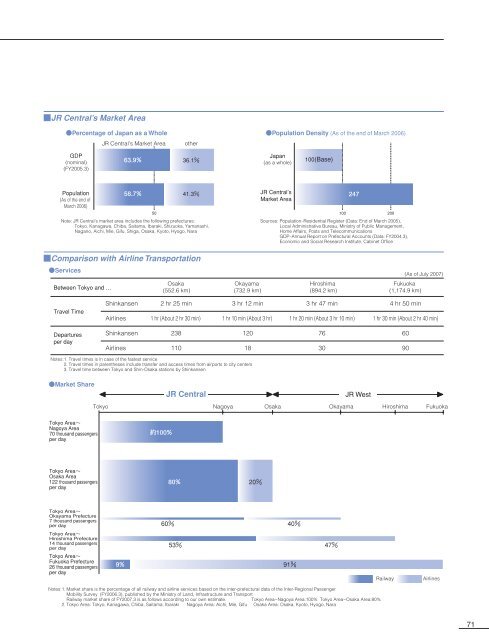
JR Central’s Market Area<br />
Percentage of Japan as a Whole Population Density (As of the end of March 2006)<br />
JR Central’s Market Area other<br />
GDP<br />
(nominal)<br />
(FY2005.3)<br />
<br />
<br />
Japan<br />
(as a whole)<br />
(Base)<br />
Population<br />
(As of the end of<br />
March 2006)<br />
<br />
<br />
Note: JR Central’s market area includes the following prefectures:<br />
Tokyo, Kanagawa, Chiba, Saitama, Ibaraki, Shizuoka, Yamanashi,<br />
Nagano, Aichi, Mie, Gifu, Shiga, Osaka, Kyoto, Hyogo, Nara<br />
JR Central’s<br />
Market Area<br />
<br />
<br />
Sources: Population–Residential Register (Data: End of March 2005),<br />
Local Administrative Bureau, Ministry of Public Management,<br />
Home Affairs, Posts and Telecommunications<br />
GDP–<strong>Annual</strong> <strong>Report</strong> on Prefectural Accounts (Data: FY2004.3),<br />
Economic and Social Research Institute, Cabinet Office<br />
Comparison with Airline Transportation<br />
Services<br />
(As of July <strong>2007</strong>)<br />
Between Tokyo and …<br />
Osaka<br />
(552.6 km)<br />
Okayama<br />
(732.9 km)<br />
Hiroshima<br />
(894.2 km)<br />
Fukuoka<br />
(1,174.9 km)<br />
Travel Time<br />
Shinkansen<br />
Airlines<br />
2 hr 25 min<br />
1 hr (About 2 hr 30 min)<br />
3 hr 12 min<br />
1 hr 10 min (About 3 hr)<br />
3 hr 47 min<br />
1 hr 20 min (About 3 hr 10 min)<br />
4 hr 50 min<br />
1 hr 30 min (About 2 hr 40 min)<br />
Departures<br />
per day<br />
Shinkansen<br />
Airlines<br />
238<br />
110<br />
120<br />
18<br />
76<br />
30<br />
60<br />
90<br />
Notes:1. Travel times is in case of the fastest service<br />
2. Travel times in parentheses include transfer and access times from airports to city centers<br />
3. Travel time between Tokyo and Shin-Osaka stations by Shinkansen<br />
Market Share<br />
JR Central<br />
JR West<br />
Tokyo Nagoya<br />
Osaka<br />
Okayama<br />
Hiroshima Fukuoka<br />
Tokyo Area<br />
Nagoya Area<br />
70 thousand passengers<br />
per day<br />
<br />
Tokyo Area<br />
Osaka Area<br />
122 thousand passengers<br />
per day<br />
<br />
<br />
Tokyo Area<br />
Okayama Prefecture<br />
7 thousand passengers<br />
per day<br />
<br />
<br />
Tokyo Area<br />
Hiroshima Prefecture<br />
14 thousand passengers<br />
per day<br />
<br />
<br />
Tokyo Area<br />
Fukuoka Prefecture<br />
26 thousand passengers<br />
per day<br />
<br />
<br />
Railway<br />
Airlines<br />
Notes:1. Market share is the percentage of all railway and airline services based on the inter-prefectural data of the Inter-Regional Passenger<br />
Mobility Survey (FY2006.3), published by the Ministry of Land, Infrastructure and Transport<br />
Railway market share of FY<strong>2007</strong>.3 is as follows according to our own estimate.<br />
Tokyo Area~Nagoya Area:100% Tokyo Area~Osaka Area:80%<br />
2. Tokyo Area: Tokyo, Kanagawa, Chiba, Saitama, Ibaraki Nagoya Area: Aichi, Mie, Gifu Osaka Area: Osaka, Kyoto, Hyogo, Nara<br />
71