Financials - PepsiCo
Financials - PepsiCo
Financials - PepsiCo

You also want an ePaper? Increase the reach of your titles
YUMPU automatically turns print PDFs into web optimized ePapers that Google loves.
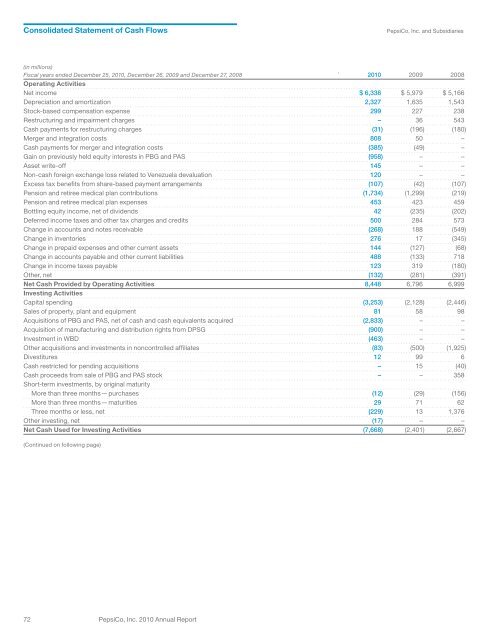
Consolidated Statement of Cash Flows<br />
<strong>PepsiCo</strong>, Inc. and Subsidiaries<br />
(in millions)<br />
Fiscal years ended December 25, 2010, December 26, 2009 and December 27, 2008 ` 2010 2009 2008<br />
Operating Activities<br />
Net income $ 6,338 $ 5,979 $ 5,166<br />
Depreciation and amortization 2,327 1,635 1,543<br />
Stock-based compensation expense 299 227 238<br />
Restructuring and impairment charges – 36 543<br />
Cash payments for restructuring charges (31) (196) (180)<br />
Merger and integration costs 808 50 –<br />
Cash payments for merger and integration costs (385) (49) –<br />
Gain on previously held equity interests in PBG and PAS (958) – –<br />
Asset write-off 145 – –<br />
Non-cash foreign exchange loss related to Venezuela devaluation 120 – –<br />
Excess tax benefits from share-based payment arrangements (107) (42) (107)<br />
Pension and retiree medical plan contributions (1,734) (1,299) (219)<br />
Pension and retiree medical plan expenses 453 423 459<br />
Bottling equity income, net of dividends 42 (235) (202)<br />
Deferred income taxes and other tax charges and credits 500 284 573<br />
Change in accounts and notes receivable (268) 188 (549)<br />
Change in inventories 276 17 (345)<br />
Change in prepaid expenses and other current assets 144 (127) (68)<br />
Change in accounts payable and other current liabilities 488 (133) 718<br />
Change in income taxes payable 123 319 (180)<br />
Other, net (132) (281) (391)<br />
Net Cash Provided by Operating Activities 8,448 6,796 6,999<br />
Investing Activities<br />
Capital spending (3,253) (2,128) (2,446)<br />
Sales of property, plant and equipment 81 58 98<br />
Acquisitions of PBG and PAS, net of cash and cash equivalents acquired (2,833) – –<br />
Acquisition of manufacturing and distribution rights from DPSG (900) – –<br />
Investment in WBD (463) – –<br />
Other acquisitions and investments in noncontrolled affiliates (83) (500) (1,925)<br />
Divestitures 12 99 6<br />
Cash restricted for pending acquisitions – 15 (40)<br />
Cash proceeds from sale of PBG and PAS stock – – 358<br />
Short-term investments, by original maturity<br />
More than three months — purchases (12) (29) (156)<br />
More than three months — maturities 29 71 62<br />
Three months or less, net (229) 13 1,376<br />
Other investing, net (17) – –<br />
Net Cash Used for Investing Activities (7,668) (2,401) (2,667)<br />
(Continued on following page)<br />
72 <strong>PepsiCo</strong>, Inc. 2010 Annual Report