Financials - PepsiCo
Financials - PepsiCo
Financials - PepsiCo

You also want an ePaper? Increase the reach of your titles
YUMPU automatically turns print PDFs into web optimized ePapers that Google loves.
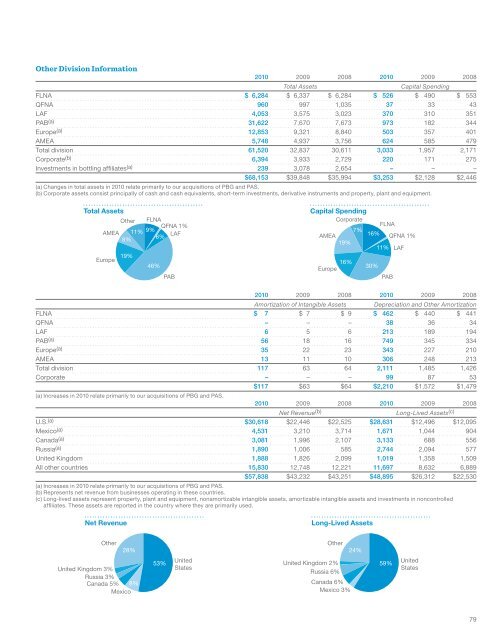
Other Division Information<br />
2010 2009 2008 2010 2009 2008<br />
Total Assets<br />
Capital Spending<br />
FLNA $ 6,284 $ 6,337 $ 6,284 $ 526 $ 490 $ 553<br />
QFNA 960 997 1,035 37 33 43<br />
LAF 4,053 3,575 3,023 370 310 351<br />
PAB (a) 31,622 7,670 7,673 973 182 344<br />
Europe (a) 12,853 9,321 8,840 503 357 401<br />
AMEA 5,748 4,937 3,756 624 585 479<br />
Total division 61,520 32,837 30,611 3,033 1,957 2,171<br />
Corporate (b) 6,394 3,933 2,729 220 171 275<br />
Investments in bottling affiliates (a) 239 3,078 2,654 – – –<br />
$68,153 $39,848 $35,994 $3,253 $2,128 $2,446<br />
(a) Changes in total assets in 2010 relate primarily to our acquisitions of PBG and PAS.<br />
(b) Corporate assets consist principally of cash and cash equivalents, short-term investments, derivative instruments and property, plant and equipment.<br />
Total Assets<br />
Other FLNA<br />
AMEA 11% 9% QFNA 1%<br />
LAF<br />
8%<br />
6%<br />
Europe<br />
19%<br />
46%<br />
PAB<br />
Capital Spending<br />
Corporate<br />
FLNA<br />
7%<br />
AMEA<br />
16% QFNA 1%<br />
19%<br />
11% LAF<br />
16%<br />
Europe<br />
30%<br />
PAB<br />
2010 2009 2008 2010 2009 2008<br />
Amortization of Intangible Assets Depreciation and Other Amortization<br />
FLNA $ 7 $ 7 $ 9 $ 462 $ 440 $ 441<br />
QFNA – – – 38 36 34<br />
LAF 6 5 6 213 189 194<br />
PAB (a) 56 18 16 749 345 334<br />
Europe (a) 35 22 23 343 227 210<br />
AMEA 13 11 10 306 248 213<br />
Total division 117 63 64 2,111 1,485 1,426<br />
Corporate – – – 99 87 53<br />
$117 $63 $64 $2,210 $1,572 $1,479<br />
(a) Increases in 2010 relate primarily to our acquisitions of PBG and PAS.<br />
2010 2009 2008 2010 2009 2008<br />
Net Revenue (b)<br />
Long-Lived Assets (c)<br />
U.S. (a) $30,618 $22,446 $22,525 $28,631 $12,496 $12,095<br />
Mexico (a) 4,531 3,210 3,714 1,671 1,044 904<br />
Canada (a) 3,081 1,996 2,107 3,133 688 556<br />
Russia (a) 1,890 1,006 585 2,744 2,094 577<br />
United Kingdom 1,888 1,826 2,099 1,019 1,358 1,509<br />
All other countries 15,830 12,748 12,221 11,697 8,632 6,889<br />
$57,838 $43,232 $43,251 $48,895 $26,312 $22,530<br />
(a) Increases in 2010 relate primarily to our acquisitions of PBG and PAS.<br />
(b) Represents net revenue from businesses operating in these countries.<br />
(c) Long-lived assets represent property, plant and equipment, nonamortizable intangible assets, amortizable intangible assets and investments in noncontrolled<br />
affiliates. These assets are reported in the country where they are primarily used.<br />
Net Revenue<br />
Long-Lived Assets<br />
Other<br />
28%<br />
Other<br />
24%<br />
United Kingdom 3%<br />
Russia 3%<br />
Canada 5% 8%<br />
Mexico<br />
53%<br />
United<br />
States<br />
United Kingdom 2%<br />
Russia 6%<br />
Canada 6%<br />
Mexico 3%<br />
59% United<br />
States<br />
79