Financials - PepsiCo
Financials - PepsiCo
Financials - PepsiCo

You also want an ePaper? Increase the reach of your titles
YUMPU automatically turns print PDFs into web optimized ePapers that Google loves.
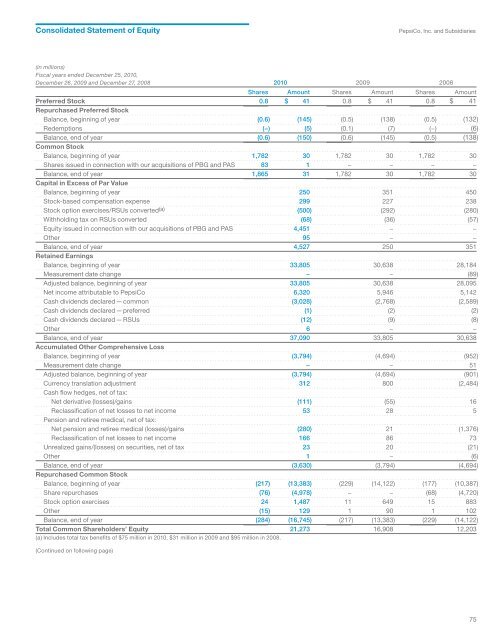
Consolidated Statement of Equity<br />
<strong>PepsiCo</strong>, Inc. and Subsidiaries<br />
(in millions)<br />
Fiscal years ended December 25, 2010,<br />
December 26, 2009 and December 27, 2008 2010 2009 2008<br />
Shares Amount Shares Amount Shares Amount<br />
Preferred Stock 0.8 $ 41 0.8 $ 41 0.8 $ 41<br />
Repurchased Preferred Stock<br />
Balance, beginning of year (0.6) (145) (0.5) (138) (0.5) (132)<br />
Redemptions (−) (5) (0.1) (7) (−) (6)<br />
Balance, end of year (0.6) (150) (0.6) (145) (0.5) (138)<br />
Common Stock<br />
Balance, beginning of year 1,782 30 1,782 30 1,782 30<br />
Shares issued in connection with our acquisitions of PBG and PAS 83 1 − − − −<br />
Balance, end of year 1,865 31 1,782 30 1,782 30<br />
Capital in Excess of Par Value<br />
Balance, beginning of year 250 351 450<br />
Stock-based compensation expense 299 227 238<br />
Stock option exercises/RSUs converted (a) (500) (292) (280)<br />
Withholding tax on RSUs converted (68) (36) (57)<br />
Equity issued in connection with our acquisitions of PBG and PAS 4,451 − −<br />
Other 95 − −<br />
Balance, end of year 4,527 250 351<br />
Retained Earnings<br />
Balance, beginning of year 33,805 30,638 28,184<br />
Measurement date change − − (89)<br />
Adjusted balance, beginning of year 33,805 30,638 28,095<br />
Net income attributable to <strong>PepsiCo</strong> 6,320 5,946 5,142<br />
Cash dividends declared — common (3,028) (2,768) (2,589)<br />
Cash dividends declared — preferred (1) (2) (2)<br />
Cash dividends declared — RSUs (12) (9) (8)<br />
Other 6 − −<br />
Balance, end of year 37,090 33,805 30,638<br />
Accumulated Other Comprehensive Loss<br />
Balance, beginning of year (3,794) (4,694) (952)<br />
Measurement date change − − 51<br />
Adjusted balance, beginning of year (3,794) (4,694) (901)<br />
Currency translation adjustment 312 800 (2,484)<br />
Cash flow hedges, net of tax:<br />
Net derivative (losses)/gains (111) (55) 16<br />
Reclassification of net losses to net income 53 28 5<br />
Pension and retiree medical, net of tax:<br />
Net pension and retiree medical (losses)/gains (280) 21 (1,376)<br />
Reclassification of net losses to net income 166 86 73<br />
Unrealized gains/(losses) on securities, net of tax 23 20 (21)<br />
Other 1 − (6)<br />
Balance, end of year (3,630) (3,794) (4,694)<br />
Repurchased Common Stock<br />
Balance, beginning of year (217) (13,383) (229) (14,122) (177) (10,387)<br />
Share repurchases (76) (4,978) − − (68) (4,720)<br />
Stock option exercises 24 1,487 11 649 15 883<br />
Other (15) 129 1 90 1 102<br />
Balance, end of year (284) (16,745) (217) (13,383) (229) (14,122)<br />
Total Common Shareholders’ Equity 21,273 16,908 12,203<br />
(a) Includes total tax benefits of $75 million in 2010, $31 million in 2009 and $95 million in 2008.<br />
(Continued on following page)<br />
75