Financials - PepsiCo
Financials - PepsiCo
Financials - PepsiCo

You also want an ePaper? Increase the reach of your titles
YUMPU automatically turns print PDFs into web optimized ePapers that Google loves.
Reconciliation of GAAP and Non-GAAP Information<br />
(continued)<br />
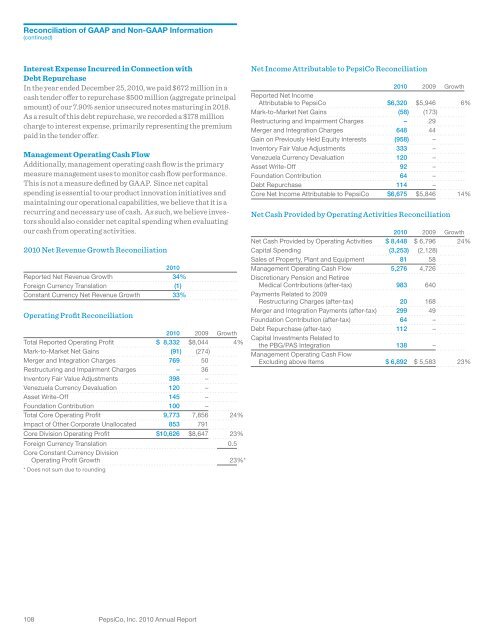
Interest Expense Incurred in Connection with<br />
Debt Repurchase<br />
In the year ended December 25, 2010, we paid $672 million in a<br />
cash tender offer to repurchase $500 million (aggregate principal<br />
amount) of our 7.90% senior unsecured notes maturing in 2018.<br />
As a result of this debt repurchase, we recorded a $178 million<br />
charge to interest expense, primarily representing the premium<br />
paid in the tender offer.<br />
Management Operating Cash Flow<br />
Additionally, management operating cash flow is the primary<br />
measure management uses to monitor cash flow performance.<br />
This is not a measure defined by GAAP. Since net capital<br />
spending is essential to our product innovation initiatives and<br />
maintaining our operational capabilities, we believe that it is a<br />
recurring and necessary use of cash. As such, we believe investors<br />
should also consider net capital spending when evaluating<br />
our cash from operating activities.<br />
2010 Net Revenue Growth Reconciliation<br />
2010<br />
Reported Net Revenue Growth 34%<br />
Foreign Currency Translation (1)<br />
Constant Currency Net Revenue Growth 33%<br />
Operating Profit Reconciliation<br />
2010 2009 Growth<br />
Total Reported Operating Profit $ 8,332 $8,044 4%<br />
Mark-to-Market Net Gains (91) (274)<br />
Merger and Integration Charges 769 50<br />
Restructuring and Impairment Charges – 36<br />
Inventory Fair Value Adjustments 398 –<br />
Venezuela Currency Devaluation 120 –<br />
Asset Write-Off 145 –<br />
Foundation Contribution 100 –<br />
Total Core Operating Profit 9,773 7,856 24%<br />
Impact of Other Corporate Unallocated 853 791<br />
Core Division Operating Profit $10,626 $8,647 23%<br />
Foreign Currency Translation 0.5<br />
Core Constant Currency Division<br />
Operating Profit Growth 23%*<br />
* Does not sum due to rounding<br />
Net Income Attributable to <strong>PepsiCo</strong> Reconciliation<br />
2010 2009 Growth<br />
Reported Net Income<br />
Attributable to <strong>PepsiCo</strong> $6,320 $5,946 6%<br />
Mark-to-Market Net Gains (58) (173)<br />
Restructuring and Impairment Charges – 29<br />
Merger and Integration Charges 648 44<br />
Gain on Previously Held Equity Interests (958) –<br />
Inventory Fair Value Adjustments 333 –<br />
Venezuela Currency Devaluation 120 –<br />
Asset Write-Off 92 –<br />
Foundation Contribution 64 –<br />
Debt Repurchase 114 –<br />
Core Net Income Attributable to <strong>PepsiCo</strong> $6,675 $5,846 14%<br />
Net Cash Provided by Operating Activities Reconciliation<br />
2010 2009 Growth<br />
Net Cash Provided by Operating Activities $ 8,448 $ 6,796 24%<br />
Capital Spending (3,253) (2,128)<br />
Sales of Property, Plant and Equipment 81 58<br />
Management Operating Cash Flow 5,276 4,726<br />
Discretionary Pension and Retiree<br />
Medical Contributions (after-tax) 983 640<br />
Payments Related to 2009<br />
Restructuring Charges (after-tax) 20 168<br />
Merger and Integration Payments (after-tax) 299 49<br />
Foundation Contribution (after-tax) 64 –<br />
Debt Repurchase (after-tax) 112 –<br />
Capital Investments Related to<br />
the PBG/PAS Integration 138 –<br />
Management Operating Cash Flow<br />
Excluding above Items $ 6,892 $ 5,583 23%<br />
108 <strong>PepsiCo</strong>, Inc. 2010 Annual Report