Financials - PepsiCo
Financials - PepsiCo
Financials - PepsiCo

Create successful ePaper yourself
Turn your PDF publications into a flip-book with our unique Google optimized e-Paper software.
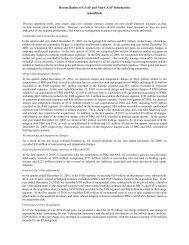
Retiree Medical Cost Trend Rates<br />
An average increase of 7% in the cost of covered retiree medical<br />
benefits is assumed for 2011. This average increase is then projected<br />
to decline gradually to 5% in 2020 and thereafter. These<br />
assumed health care cost trend rates have an impact on the<br />
retiree medical plan expense and liability. However, the cap on<br />
our share of retiree medical costs limits the impact. In addition,<br />
beginning January 1, 2011, the Company will start phasing out<br />
company subsidies of retiree medical benefits. A 1-percentagepoint<br />
change in the assumed health care trend rate would have<br />
the following effects:<br />
1% 1%<br />
Increase Decrease<br />
2010 service and interest cost components $ 5 $ (4)<br />
2010 benefit liability $42 $(50)<br />
Savings Plan<br />
Our U.S. employees are eligible to participate in 401(k) savings<br />
plans, which are voluntary defined contribution plans. The<br />
plans are designed to help employees accumulate additional<br />
savings for retirement, and we make company matching contributions<br />
on a portion of eligible pay based on years of service.<br />
In 2010, in connection with our acquisitions of PBG and PAS,<br />
we also made company retirement contributions for certain<br />
employees on a portion of eligible pay based on years of service.<br />
In 2010 and 2009, our total contributions were $135 million and<br />
$72 million, respectively.<br />
Beginning January 1, 2011, a new employer contribution to<br />
the 401(k) savings plan will become effective for certain eligible<br />
legacy PBG and PAS salaried employees as well as all future<br />
eligible salaried new hires of <strong>PepsiCo</strong> who are not eligible to<br />
participate in the defined benefit pension plan as a result of plan<br />
design changes approved during 2010.<br />
For additional unaudited information on our pension<br />
and retiree medical plans and related accounting policies and<br />
assumptions, see “Our Critical Accounting Policies” in<br />
Management’s Discussion and Analysis.<br />
Note 8 Noncontrolled<br />
Bottling Affiliates<br />
On February 26, 2010, we completed our acquisitions of PBG<br />
and PAS, at which time we gained control over their operations<br />
and began to consolidate their results. See Note 1. Prior to these<br />
acquisitions, PBG and PAS represented our most significant<br />
noncontrolled bottling affiliates. Sales to PBG in 2010 (prior to<br />
the acquisition date) represented less than 1% of our total net<br />
revenue in 2010, 6% of our total net revenue in 2009 and 7% of our<br />
total net revenue in 2008.<br />
See Note 15 for additional information regarding our acquisitions<br />
of PBG and PAS.<br />
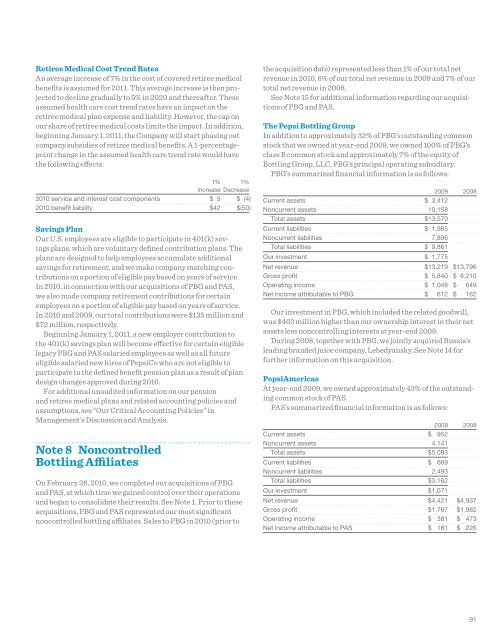
The Pepsi Bottling Group<br />
In addition to approximately 32% of PBG’s outstanding common<br />
stock that we owned at year-end 2009, we owned 100% of PBG’s<br />
class B common stock and approximately 7% of the equity of<br />
Bottling Group, LLC, PBG’s principal operating subsidiary.<br />
PBG’s summarized financial information is as follows:<br />
2009 2008<br />
Current assets $ 3,412<br />
Noncurrent assets 10,158<br />
Total assets $13,570<br />
Current liabilities $ 1,965<br />
Noncurrent liabilities 7,896<br />
Total liabilities $ 9,861<br />
Our investment $ 1,775<br />
Net revenue $13,219 $13,796<br />
Gross profit $ 5,840 $ 6,210<br />
Operating income $ 1,048 $ 649<br />
Net income attributable to PBG $ 612 $ 162<br />
Our investment in PBG, which included the related goodwill,<br />
was $463 million higher than our ownership interest in their net<br />
assets less noncontrolling interests at year-end 2009.<br />
During 2008, together with PBG, we jointly acquired Russia’s<br />
leading branded juice company, Lebedyansky. See Note 14 for<br />
further information on this acquisition.<br />
PepsiAmericas<br />
At year-end 2009, we owned approximately 43% of the outstanding<br />
common stock of PAS.<br />
PAS’s summarized financial information is as follows:<br />
2009 2008<br />
Current assets $ 952<br />
Noncurrent assets 4,141<br />
Total assets $5,093<br />
Current liabilities $ 669<br />
Noncurrent liabilities 2,493<br />
Total liabilities $3,162<br />
Our investment $1,071<br />
Net revenue $4,421 $4,937<br />
Gross profit $1,767 $1,982<br />
Operating income $ 381 $ 473<br />
Net income attributable to PAS $ 181 $ 226<br />
91