Conservation and Management Strategy for the Elephant in Kenya
Conservation and Management Strategy for the Elephant in Kenya
Conservation and Management Strategy for the Elephant in Kenya

Create successful ePaper yourself
Turn your PDF publications into a flip-book with our unique Google optimized e-Paper software.
6 CONSERVATION AND MANAGEMENT STRATEGY FOR THE ELEPHANT IN KENYA<br />
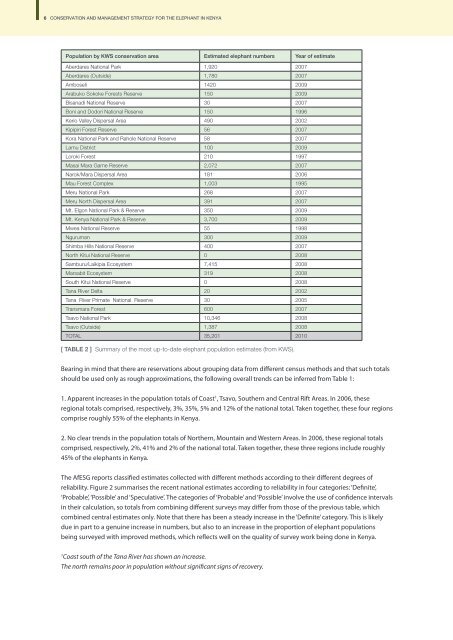
Population by KWS conservation area Estimated elephant numbers Year of estimate<br />
Aberdares National Park 1,920 2007<br />
Aberdares (Outside) 1,780 2007<br />
Amboseli 1420 2009<br />
Arabuko Sokoke Forests Reserve 150 2009<br />
Bisanadi National Reserve 30 2007<br />
Boni <strong>and</strong> Dodori National Reserve 150 1996<br />
Kerio Valley Dispersal Area 490 2002<br />
Kipipiri Forest Reserve 56 2007<br />
Kora National Park <strong>and</strong> Rahole National Reserve 58 2007<br />
Lamu District 100 2009<br />
Loroki Forest 210 1997<br />
Masai Mara Game Reserve 2,072 2007<br />
Narok/Mara Dispersal Area 181 2006<br />
Mau Forest Complex 1,003 1995<br />
Meru National Park 268 2007<br />
Meru North Dispersal Area 391 2007<br />
Mt. Elgon National Park & Reserve 350 2009<br />
Mt. <strong>Kenya</strong> National Park & Reserve 3,700 2009<br />
Mwea National Reserve 55 1998<br />
Nguruman 300 2009<br />
Shimba Hills National Reserve 400 2007<br />
North Kitui National Reserve 0 2008<br />
Samburu/Laikipia Ecosystem 7,415 2008<br />
Marsabit Ecosystem 319 2008<br />
South Kitui National Reserve 0 2008<br />
Tana River Delta 20 2002<br />
Tana River Primate National Reserve 30 2005<br />
Transmara Forest 600 2007<br />
Tsavo National Park 10,346 2008<br />
Tsavo (Outside) 1,387 2008<br />
TOTAL 35,201 2010<br />
[ TABLE 2 ] Summary of <strong>the</strong> most up-to-date elephant population estimates (from KWS).<br />
Bear<strong>in</strong>g <strong>in</strong> m<strong>in</strong>d that <strong>the</strong>re are reservations about group<strong>in</strong>g data from different census methods <strong>and</strong> that such totals<br />
should be used only as rough approximations, <strong>the</strong> follow<strong>in</strong>g overall trends can be <strong>in</strong>ferred from Table 1:<br />
1. Apparent <strong>in</strong>creases <strong>in</strong> <strong>the</strong> population totals of Coast 1 , Tsavo, Sou<strong>the</strong>rn <strong>and</strong> Central Rift Areas. In 2006, <strong>the</strong>se<br />
regional totals comprised, respectively, 3%, 35%, 5% <strong>and</strong> 12% of <strong>the</strong> national total. Taken toge<strong>the</strong>r, <strong>the</strong>se four regions<br />
comprise roughly 55% of <strong>the</strong> elephants <strong>in</strong> <strong>Kenya</strong>.<br />
2. No clear trends <strong>in</strong> <strong>the</strong> population totals of Nor<strong>the</strong>rn, Mounta<strong>in</strong> <strong>and</strong> Western Areas. In 2006, <strong>the</strong>se regional totals<br />
comprised, respectively, 2%, 41% <strong>and</strong> 2% of <strong>the</strong> national total. Taken toge<strong>the</strong>r, <strong>the</strong>se three regions <strong>in</strong>clude roughly<br />
45% of <strong>the</strong> elephants <strong>in</strong> <strong>Kenya</strong>.<br />
The AfESG reports classified estimates collected with different methods accord<strong>in</strong>g to <strong>the</strong>ir different degrees of<br />
reliability. Figure 2 summarises <strong>the</strong> recent national estimates accord<strong>in</strong>g to reliability <strong>in</strong> four categories: ‘Def<strong>in</strong>ite’,<br />
‘Probable’, ‘Possible’ <strong>and</strong> ‘Speculative’. The categories of ‘Probable’ <strong>and</strong> ‘Possible’ <strong>in</strong>volve <strong>the</strong> use of confidence <strong>in</strong>tervals<br />
<strong>in</strong> <strong>the</strong>ir calculation, so totals from comb<strong>in</strong><strong>in</strong>g different surveys may differ from those of <strong>the</strong> previous table, which<br />
comb<strong>in</strong>ed central estimates only. Note that <strong>the</strong>re has been a steady <strong>in</strong>crease <strong>in</strong> <strong>the</strong> ‘Def<strong>in</strong>ite’ category. This is likely<br />
due <strong>in</strong> part to a genu<strong>in</strong>e <strong>in</strong>crease <strong>in</strong> numbers, but also to an <strong>in</strong>crease <strong>in</strong> <strong>the</strong> proportion of elephant populations<br />
be<strong>in</strong>g surveyed with improved methods, which reflects well on <strong>the</strong> quality of survey work be<strong>in</strong>g done <strong>in</strong> <strong>Kenya</strong>.<br />
1<br />
Coast south of <strong>the</strong> Tana River has shown an <strong>in</strong>crease.<br />
The north rema<strong>in</strong>s poor <strong>in</strong> population without significant signs of recovery.