Conservation and Management Strategy for the Elephant in Kenya
Conservation and Management Strategy for the Elephant in Kenya
Conservation and Management Strategy for the Elephant in Kenya

You also want an ePaper? Increase the reach of your titles
YUMPU automatically turns print PDFs into web optimized ePapers that Google loves.
CONSERVATION AND MANAGEMENT STRATEGY FOR THE ELEPHANT IN KENYA 9<br />
The small Meru population has been surveyed <strong>in</strong> aerial total counts from 1990 to 2006 <strong>and</strong> has shown an annual<br />
<strong>in</strong>crease rate of 4.3% (Figure 5) whist <strong>the</strong> Masai Mara population has on average grown by 2.4% (Figure 6) <strong>and</strong><br />
Samburu/Laikipia by an average of 6.25% (Figure 7).<br />
These population trends should not be taken as an <strong>in</strong>dication of <strong>the</strong> national elephant population; <strong>the</strong>y are simply<br />
<strong>the</strong> only ones with a reasonable time series of good quality data <strong>and</strong> this selection is likely to be biased towards<br />
better protected populations.<br />
A key factor affect<strong>in</strong>g elephant population status is observed rates of elephant mortality. There<strong>for</strong>e, a centralised<br />
<strong>Elephant</strong> Mortality Database was established at KWS headquarters <strong>in</strong> 1990. The average PIKE value was 35.3% from<br />
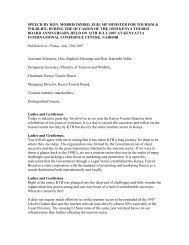
1990 to 2002 (Thouless et al., 2008) <strong>and</strong> has rema<strong>in</strong>ed high at 35.9% over <strong>the</strong> period up-to 2009 (Figure 8, Figure 9),<br />
with regions with complete dataset (exclud<strong>in</strong>g Eastern <strong>and</strong> Western regions) arranged <strong>in</strong> rank order of PIKE <strong>in</strong> Figure<br />
10. The rank order<strong>in</strong>g of PIKE, is a convenient way of sort<strong>in</strong>g areas with a high level of risk to elephants from illegal<br />
kill<strong>in</strong>g from those with a low risk, depend<strong>in</strong>g on whe<strong>the</strong>r <strong>the</strong>y fall above or below <strong>the</strong> average PIKE value. This<br />
separates <strong>the</strong> populations of Coast (south of Tana river), Tsavo, <strong>and</strong> Sou<strong>the</strong>rn, all of which are known to be relatively<br />
well protected, from those of Mt. Elgon, Central Rift, Meru, Nor<strong>the</strong>rn, Samburu-Laikipia <strong>and</strong> Mounta<strong>in</strong>, all of which<br />
were known <strong>in</strong> <strong>the</strong> period to be poorly protected or to have high levels of HEC. The major threat to <strong>the</strong> nor<strong>the</strong>rn<br />
elephant populations is likely to be <strong>the</strong> large numbers of firearms <strong>in</strong> <strong>the</strong> h<strong>and</strong>s of local communities, largely s<strong>in</strong>ce <strong>the</strong><br />
breakdown of law <strong>and</strong> order <strong>in</strong> Somalia <strong>in</strong> <strong>the</strong> early 1990s.<br />
100%<br />
90%<br />
Percent of all carcasses<br />
80%<br />
70%<br />
60%<br />
50%<br />
40%<br />
30%<br />
20%<br />
10%<br />
152<br />
75<br />
92<br />
65<br />
84<br />
102<br />
137<br />
82<br />
148<br />
115<br />
236<br />
112<br />
216<br />
113<br />
149<br />
73<br />
248<br />
222<br />
928<br />
381<br />
0%<br />
2000 2001 2002 2003 2004 2005 2006 2007 2008 2009<br />
Year<br />
[ FIGURE 8 ]<br />
The proportion of illegally killed elephants (PIKE; dark portion of columns) contrasted with o<strong>the</strong>r causes of<br />
elephant mortality (white portion of columns)