Annual Report 2008-2009 - Bharat Petroleum
Annual Report 2008-2009 - Bharat Petroleum
Annual Report 2008-2009 - Bharat Petroleum

You also want an ePaper? Increase the reach of your titles
YUMPU automatically turns print PDFs into web optimized ePapers that Google loves.
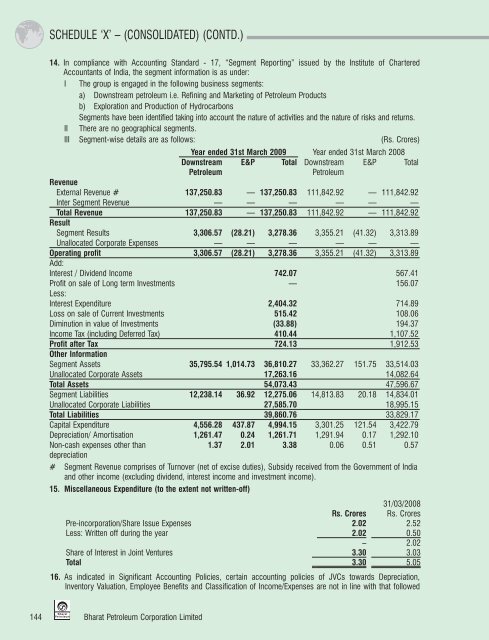
SCHEDULE ‘X’ – (CONSOLIDATED) (CONTD.)<br />
14. In compliance with Accounting Standard - 17, “Segment <strong>Report</strong>ing” issued by the Institute of Chartered<br />
Accountants of India, the segment information is as under:<br />
I The group is engaged in the following business segments:<br />
a) Downstream petroleum i.e. Refining and Marketing of <strong>Petroleum</strong> Products<br />
b) Exploration and Production of Hydrocarbons<br />
Segments have been identified taking into account the nature of activities and the nature of risks and returns.<br />
II There are no geographical segments.<br />
III Segment-wise details are as follows: (Rs. Crores)<br />
Year ended 31st March <strong>2009</strong> Year ended 31st March <strong>2008</strong><br />
Downstream E&P Total Downstream E&P Total<br />
<strong>Petroleum</strong><br />
<strong>Petroleum</strong><br />
Revenue<br />
External Revenue # 137,250.83 — 137,250.83 111,842.92 — 111,842.92<br />
Inter Segment Revenue — — — — — —<br />
Total Revenue 137,250.83 — 137,250.83 111,842.92 — 111,842.92<br />
Result<br />
Segment Results 3,306.57 (28.21) 3,278.36 3,355.21 (41.32) 3,313.89<br />
Unallocated Corporate Expenses — — — — — —<br />
Operating profit 3,306.57 (28.21) 3,278.36 3,355.21 (41.32) 3,313.89<br />
Add:<br />
Interest / Dividend Income 742.07 567.41<br />
Profit on sale of Long term Investments — 156.07<br />
Less:<br />
Interest Expenditure 2,404.32 714.89<br />
Loss on sale of Current Investments 515.42 108.06<br />
Diminution in value of Investments (33.88) 194.37<br />
Income Tax (including Deferred Tax) 410.44 1,107.52<br />
Profit after Tax 724.13 1,912.53<br />
Other Information<br />
Segment Assets 35,795.54 1,014.73 36,810.27 33,362.27 151.75 33,514.03<br />
Unallocated Corporate Assets 17,263.16 14,082.64<br />
Total Assets 54,073.43 47,596.67<br />
Segment Liabilities 12,238.14 36.92 12,275.06 14,813.83 20.18 14,834.01<br />
Unallocated Corporate Liabilities 27,585.70 18,995.15<br />
Total Liabilities 39,860.76 33,829.17<br />
Capital Expenditure 4,556.28 437.87 4,994.15 3,301.25 121.54 3,422.79<br />
Depreciation/ Amortisation 1,261.47 0.24 1,261.71 1,291.94 0.17 1,292.10<br />
Non-cash expenses other than<br />
1.37 2.01 3.38 0.06 0.51 0.57<br />
depreciation<br />
# Segment Revenue comprises of Turnover (net of excise duties), Subsidy received from the Government of India<br />
and other income (excluding dividend, interest income and investment income).<br />
15. Miscellaneous Expenditure (to the extent not written-off)<br />
31/03/<strong>2008</strong><br />
Rs. Crores Rs. Crores<br />
Pre-incorporation/Share Issue Expenses 2.02 2.52<br />
Less: Written off during the year 2.02 0.50<br />
– 2.02<br />
Share of Interest in Joint Ventures 3.30 3.03<br />
Total 3.30 5.05<br />
16. As indicated in Significant Accounting Policies, certain accounting policies of JVCs towards Depreciation,<br />
Inventory Valuation, Employee Benefits and Classification of Income/Expenses are not in line with that followed<br />
144 <strong>Bharat</strong> <strong>Petroleum</strong> Corporation Limited