WTO: World Trade Report 2010 - World Trade Organization
WTO: World Trade Report 2010 - World Trade Organization
WTO: World Trade Report 2010 - World Trade Organization

Create successful ePaper yourself
Turn your PDF publications into a flip-book with our unique Google optimized e-Paper software.
world trade report <strong>2010</strong><br />
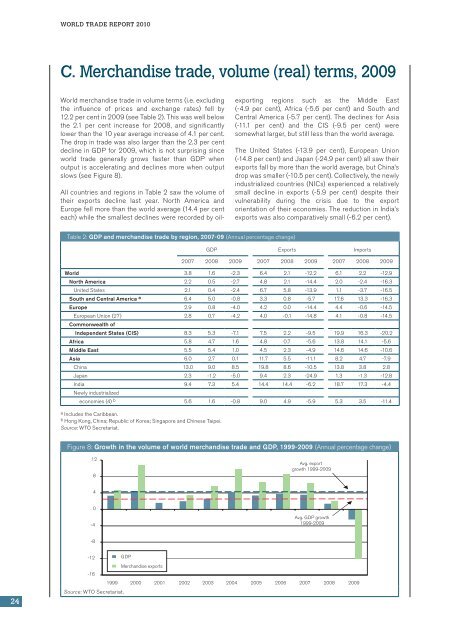
C. Merchandise trade, volume (real) terms, 2009<br />
<strong>World</strong> merchandise trade in volume terms (i.e. excluding<br />
the influence of prices and exchange rates) fell by<br />
12.2 per cent in 2009 (see Table 2). This was well below<br />
the 2.1 per cent increase for 2008, and significantly<br />
lower than the 10 year average increase of 4.1 per cent.<br />
The drop in trade was also larger than the 2.3 per cent<br />
decline in GDP for 2009, which is not surprising since<br />
world trade generally grows faster than GDP when<br />
output is accelerating and declines more when output<br />
slows (see Figure 8).<br />
All countries and regions in Table 2 saw the volume of<br />
their exports decline last year. North America and<br />
Europe fell more than the world average (14.4 per cent<br />
each) while the smallest declines were recorded by oilexporting<br />
regions such as the Middle East<br />
(-4.9 per cent), Africa (-5.6 per cent) and South and<br />
Central America (-5.7 per cent). The declines for Asia<br />
(-11.1 per cent) and the CIS (-9.5 per cent) were<br />
somewhat larger, but still less than the world average.<br />
The United States (-13.9 per cent), European Union<br />
(‐14.8 per cent) and Japan (-24.9 per cent) all saw their<br />
exports fall by more than the world average, but China’s<br />
drop was smaller (‐10.5 per cent). Collectively, the newly<br />
industrialized countries (NICs) experienced a relatively<br />
small decline in exports (-5.9 per cent) despite their<br />
vulnerability during the crisis due to the export<br />
orientation of their economies. The reduction in India’s<br />
exports was also comparatively small (-6.2 per cent).<br />
Table 2: GDP and merchandise trade by region, 2007-09 (Annual percentage change)<br />
GDP Exports Imports<br />
2007 2008 2009 2007 2008 2009 2007 2008 2009<br />
<strong>World</strong> 3.8 1.6 -2.3 6.4 2.1 -12.2 6.1 2.2 -12.9<br />
North America 2.2 0.5 -2.7 4.8 2.1 -14.4 2.0 -2.4 -16.3<br />
United States 2.1 0.4 -2.4 6.7 5.8 -13.9 1.1 -3.7 -16.5<br />
South and Central America a 6.4 5.0 -0.8 3.3 0.8 -5.7 17.6 13.3 -16.3<br />
Europe 2.9 0.8 -4.0 4.2 0.0 -14.4 4.4 -0.6 -14.5<br />
European Union (27) 2.8 0.7 -4.2 4.0 -0.1 -14.8 4.1 -0.8 -14.5<br />
Commonwealth of<br />
Independent States (CIS) 8.3 5.3 -7.1 7.5 2.2 -9.5 19.9 16.3 -20.2<br />
Africa 5.8 4.7 1.6 4.8 0.7 -5.6 13.8 14.1 -5.6<br />
Middle East 5.5 5.4 1.0 4.5 2.3 -4.9 14.6 14.6 -10.6<br />
Asia 6.0 2.7 0.1 11.7 5.5 -11.1 8.2 4.7 -7.9<br />
China 13.0 9.0 8.5 19.8 8.6 -10.5 13.8 3.8 2.8<br />
Japan 2.3 -1.2 -5.0 9.4 2.3 -24.9 1.3 -1.3 -12.8<br />
India 9.4 7.3 5.4 14.4 14.4 -6.2 18.7 17.3 -4.4<br />
Newly industrialized<br />
economies (4) b 5.6 1.6 -0.8 9.0 4.9 -5.9 5.3 3.5 -11.4<br />
a Includes the Caribbean.<br />
b Hong Kong, China; Republic of Korea; Singapore and Chinese Taipei.<br />
Source: <strong>WTO</strong> Secretariat.<br />
Figure 8: Growth in the volume of world merchandise trade and GDP, 1999-2009 (Annual percentage change)<br />
12<br />
8<br />
Avg. export<br />
growth 1999-2009<br />
4<br />
0<br />
-4<br />
Avg. GDP growth<br />
1999-2009<br />
-8<br />
24<br />
-12<br />
GDP<br />
Merchandise exports<br />
-16<br />
1999 2000 2001 2002 2003 2004 2005 2006 2007 2008 2009<br />
Source: <strong>WTO</strong> Secretariat.