WTO: World Trade Report 2010 - World Trade Organization
WTO: World Trade Report 2010 - World Trade Organization
WTO: World Trade Report 2010 - World Trade Organization

Create successful ePaper yourself
Turn your PDF publications into a flip-book with our unique Google optimized e-Paper software.
world trade report <strong>2010</strong><br />
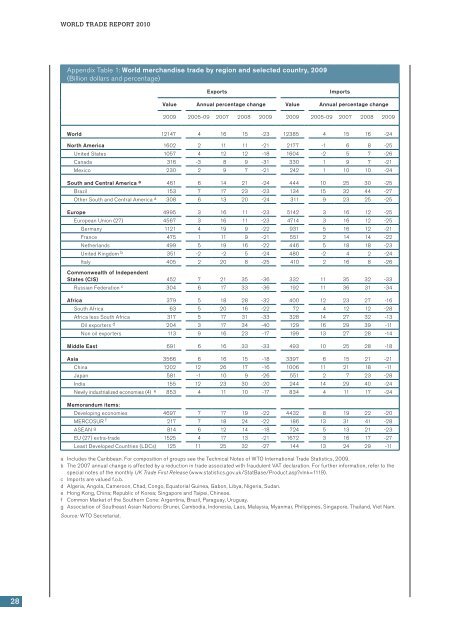
Appendix Table 1: <strong>World</strong> merchandise trade by region and selected country, 2009<br />
(Billion dollars and percentage)<br />
Exports<br />
Imports<br />
Value Annual percentage change Value Annual percentage change<br />
2009 2005-09 2007 2008 2009 2009 2005-09 2007 2008 2009<br />
<strong>World</strong> 12147 4 16 15 -23 12385 4 15 16 -24<br />
North America 1602 2 11 11 -21 2177 -1 6 8 -25<br />
United States 1057 4 12 12 -18 1604 -2 5 7 -26<br />
Canada 316 -3 8 9 -31 330 1 9 7 -21<br />
Mexico 230 2 9 7 -21 242 1 10 10 -24<br />
South and Central America a 461 6 14 21 -24 444 10 25 30 -25<br />
Brazil 153 7 17 23 -23 134 15 32 44 -27<br />
Other South and Central America a 308 6 13 20 -24 311 9 23 25 -25<br />
Europe 4995 3 16 11 -23 5142 3 16 12 -25<br />
European Union (27) 4567 3 16 11 -23 4714 3 16 12 -25<br />
Germany 1121 4 19 9 -22 931 5 16 12 -21<br />
France 475 1 11 9 -21 551 2 14 14 -22<br />
Netherlands 499 5 19 16 -22 446 5 18 18 -23<br />
United Kingdom b 351 -2 -2 5 -24 480 -2 4 2 -24<br />
Italy 405 2 20 8 -25 410 2 16 8 -26<br />
Commonwealth of Independent<br />
States (CIS) 452 7 21 35 -36 332 11 35 32 -33<br />
Russian Federation c 304 6 17 33 -36 192 11 36 31 -34<br />
Africa 379 5 18 28 -32 400 12 23 27 -16<br />
South Africa 63 5 20 16 -22 72 4 12 12 -28<br />
Africa less South Africa 317 5 17 31 -33 328 14 27 32 -13<br />
Oil exporters d 204 3 17 34 -40 129 16 29 39 -11<br />
Non oil exporters 113 9 16 23 -17 199 13 27 28 -14<br />
Middle East 691 6 16 33 -33 493 10 25 28 -18<br />
Asia 3566 6 16 15 -18 3397 6 15 21 -21<br />
China 1202 12 26 17 -16 1006 11 21 18 -11<br />
Japan 581 -1 10 9 -26 551 2 7 23 -28<br />
India 155 12 23 30 -20 244 14 29 40 -24<br />
Newly industrialized economies (4) e 853 4 11 10 -17 834 4 11 17 -24<br />
Memorandum items:<br />
Developing economies 4697 7 17 19 -22 4432 8 19 22 -20<br />
MERCOSUR f 217 7 18 24 -22 186 13 31 41 -28<br />
ASEAN g 814 6 12 14 -18 724 5 13 21 -23<br />
EU (27) extra-trade 1525 4 17 13 -21 1672 3 16 17 -27<br />
Least Developed Countries (LDCs) 125 11 25 32 -27 144 13 24 29 -11<br />
a Includes the Caribbean. For composition of groups see the Technical Notes of <strong>WTO</strong> International <strong>Trade</strong> Statistics, 2009.<br />
b The 2007 annual change is affected by a reduction in trade associated with fraudulent VAT declaration. For further information, refer to the<br />
special notes of the monthly UK <strong>Trade</strong> First Release (www.statistics.gov.uk/StatBase/Product.asp?vlnk=1119).<br />
c Imports are valued f.o.b.<br />
d Algeria, Angola, Cameroon, Chad, Congo, Equatorial Guinea, Gabon, Libya, Nigeria, Sudan.<br />
e Hong Kong, China; Republic of Korea; Singapore and Taipei, Chinese.<br />
f Common Market of the Southern Cone: Argentina, Brazil, Paraguay, Uruguay.<br />
g Association of Southeast Asian Nations: Brunei, Cambodia, Indonesia, Laos, Malaysia, Myanmar, Philippines, Singapore, Thailand, Viet Nam.<br />
Source: <strong>WTO</strong> Secretariat.<br />
28