WTO: World Trade Report 2010 - World Trade Organization
WTO: World Trade Report 2010 - World Trade Organization
WTO: World Trade Report 2010 - World Trade Organization

Create successful ePaper yourself
Turn your PDF publications into a flip-book with our unique Google optimized e-Paper software.
world trade report <strong>2010</strong><br />
D. Merchandise and services trade,<br />
value (nominal) terms, 2009<br />
1. Merchandise trade<br />
The US dollar value of world merchandise trade fell<br />
23 per cent in 2009 to US$ 12.1 trillion, down from<br />
US$ 16.1 trillion in 2008 (see Appendix Table 1). Some<br />
of this decline was due to changes in trade volumes,<br />
while much of the rest can be explained by falling<br />
commodity prices in 2009, particularly for oil. After<br />
rising to record levels in 2008, world crude oil prices<br />
plunged 37 per cent in 2009, from US$ 95 per barrel to<br />
US$ 60 per barrel on average. As a result, nominal<br />
trade developments for particular countries and regions<br />
may differ substantially from developments in volume<br />
terms, particularly for oil exporters on the export side<br />
and oil importers on the import side.<br />
North America’s merchandise exports fell 21 per cent in<br />
2009, from US$ 2.0 trillion to US$ 1.6 trillion, while<br />
imports dropped 25 per cent from US$ 2.9 trillion to<br />
US$ 2.2 trillion. The percentage declines on both the<br />
export and import sides were roughly in line with the<br />
overall drop in world trade, as were those for South and<br />
Central America. Exports of the latter fell 24 per cent to<br />
US$ 461 billion while the region’s imports dropped<br />
25 per cent to US$ 444 billion. The story for Europe<br />
was similar, with exports falling 23 per cent to US$ 5.0<br />
trillion and imports shrinking by 24 per cent to US$ 5.1<br />
trillion.<br />
Oil-producing regions recorded declines in exports that<br />
were much larger than the overall decline in world trade,<br />
including the CIS, which saw its exports fall more than<br />
any other region (-36 per cent to US$ 452 billion). The<br />
CIS also had the largest percentage decline on the<br />
import side, as purchases from the rest of the world fell<br />
33 per cent to US$ 332 billion. Africa’s exports dropped<br />
by 32 per cent to US$ 379 billion, but the decline in the<br />
continent’s imports was smaller than any other region’s<br />
(-16 per cent to US$ 400 billion). Results for the Middle<br />
East were similar to those for Africa, with exports falling<br />
33 per cent to US$ 691 billion and imports dropping<br />
18 per cent to US$ 493 billion.<br />
Asia’s exports were down 18 per cent in 2009, from<br />
US$ 4.7 trillion to US$ 3.6 trillion, the smallest nominal<br />
decline of any region. Asia’s imports also fell less than<br />
the world average, 21 per cent to US$ 3.4 trillion. This<br />
relatively strong performance rested on China’s ability<br />
to minimize the impact of the economic crisis on its<br />
trade flows. The country’s exports fell 16 per cent to<br />
US$ 1.2 trillion last year, while its imports declined by<br />
just 11 per cent to US$ 1.0 trillion.<br />
As many observers had predicted, China overtook<br />
Germany as the world’s leading exporter in 2009 with a<br />
9.6 per cent share in world trade (see Appendix Table 3).<br />
The other top exporters were Germany (9.0 per cent),<br />
the United States (8.5 per cent), Japan (4.7 per cent),<br />
and the Netherlands (4.0 per cent). Among major<br />
economies, the country that advanced the most in world<br />
export rankings was the Republic of Korea, which<br />
moved from 12 th to 9 th place. The country that fell<br />
furthest was the Russian Federation, which dropped<br />
from 9 th to 13 th position.<br />
The United States remained the leading merchandise<br />
importer with a 12.7 per cent share in world trade. China<br />
(8.0 per cent) took over second place from Germany<br />
(7.4 per cent), which fell to third place. France<br />
(4.4 per cent) and Japan (4.4 per cent) exchanged<br />
places, with France taking over the fourth position and<br />
Japan dropping to fifth. Appendix Table 4 shows<br />
rankings in world trade excluding EU intra-trade, which<br />
places the European Union atop the rankings on both<br />
the export and import sides.<br />
2. Commercial services trade<br />
<strong>World</strong> commercial services exports fell 13 per cent in<br />
2009, from US$ 3.8 trillion to US$ 3.3 trillion (see<br />
Table 3). Although smaller than the 23 per cent drop in<br />
merchandise trade, it was the largest decline ever<br />
recorded for services in a data series going back to<br />
1980. It was also the first time since 1983 that trade in<br />
commercial services declined year on year.<br />
Transport recorded the largest drop among services<br />
categories, followed by travel and other commercial<br />
services (see Table 4). The drop in transport services is<br />
unsurprising since this category is closely linked to<br />
trade in goods, which fell by a similar amount. One might<br />
have expected a larger decline in other commercial<br />
services, since this category includes financial services<br />
that were at the centre of the recent crisis. However,<br />
these trade flows are often based on long-term<br />
contractual relationships with suppliers, possibly<br />
making them less sensitive to short-term fluctuations in<br />
the business cycle.<br />
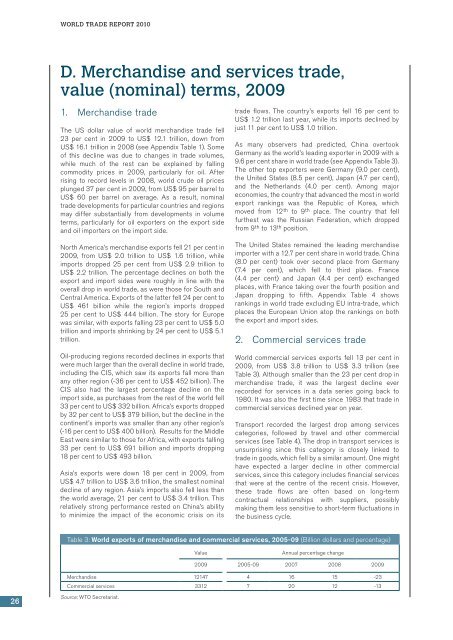
Table 3: <strong>World</strong> exports of merchandise and commercial services, 2005-09 (Billion dollars and percentage)<br />
Value<br />
Annual percentage change<br />
2009 2005-09 2007 2008 2009<br />
Merchandise 12147 4 16 15 -23<br />
Commercial services 3312 7 20 12 -13<br />
26<br />
Source: <strong>WTO</strong> Secretariat.