WTO: World Trade Report 2010 - World Trade Organization
WTO: World Trade Report 2010 - World Trade Organization
WTO: World Trade Report 2010 - World Trade Organization

You also want an ePaper? Increase the reach of your titles
YUMPU automatically turns print PDFs into web optimized ePapers that Google loves.
world trade report <strong>2010</strong><br />
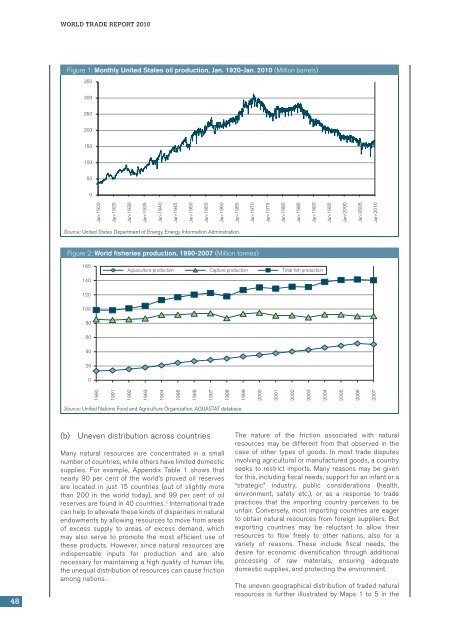
Figure 1: Monthly United States oil production, Jan. 1920-Jan. <strong>2010</strong> (Million barrels)<br />
350<br />
300<br />
250<br />
200<br />
150<br />
100<br />
50<br />
0<br />
Jan-1920<br />
Jan-1925<br />
Jan-1930<br />
Jan-1935<br />
Jan-1940<br />
Jan-1945<br />
Jan-1950<br />
Jan-1955<br />
Jan-1960<br />
Jan-1965<br />
Jan-1970<br />
Jan-1975<br />
Jan-1980<br />
Jan-1985<br />
Jan-1990<br />
Jan-1995<br />
Jan-2000<br />
Jan-2005<br />
Jan-<strong>2010</strong><br />
Source: United States Department of Energy, Energy Information Adminstration.<br />
Figure 2: <strong>World</strong> fisheries production, 1990-2007 (Million tonnes)<br />
160<br />
Aquaculture production Capture production Total fish production<br />
140<br />
120<br />
100<br />
80<br />
60<br />
40<br />
20<br />
0<br />
1990<br />
1991<br />
1992<br />
1993<br />
1994<br />
1995<br />
1996<br />
1997<br />
1998<br />
1999<br />
2000<br />
2001<br />
2002<br />
2003<br />
2004<br />
2005<br />
2006<br />
2007<br />
Source: United Nations Food and Agriculture <strong>Organization</strong>, AQUASTAT database.<br />
48<br />
(b) Uneven distribution across countries<br />
Many natural resources are concentrated in a small<br />
number of countries, while others have limited domestic<br />
supplies. For example, Appendix Table 1 shows that<br />
nearly 90 per cent of the world’s proved oil reserves<br />
are located in just 15 countries (out of slightly more<br />
than 200 in the world today), and 99 per cent of oil<br />
reserves are found in 40 countries. 3 International trade<br />
can help to alleviate these kinds of disparities in natural<br />
endowments by allowing resources to move from areas<br />
of excess supply to areas of excess demand, which<br />
may also serve to promote the most efficient use of<br />
these products. However, since natural resources are<br />
indispensable inputs for production and are also<br />
necessary for maintaining a high quality of human life,<br />
the unequal distribution of resources can cause friction<br />
among nations.<br />
The nature of the friction associated with natural<br />
resources may be different from that observed in the<br />
case of other types of goods. In most trade disputes<br />
involving agricultural or manufactured goods, a country<br />
seeks to restrict imports. Many reasons may be given<br />
for this, including fiscal needs, support for an infant or a<br />
“strategic” industry, public considerations (health,<br />
environment, safety etc.), or as a response to trade<br />
practices that the importing country perceives to be<br />
unfair. Conversely, most importing countries are eager<br />
to obtain natural resources from foreign suppliers. But<br />
exporting countries may be reluctant to allow their<br />
resources to flow freely to other nations, also for a<br />
variety of reasons. These include fiscal needs, the<br />
desire for economic diversification through additional<br />
processing of raw materials, ensuring adequate<br />
domestic supplies, and protecting the environment.<br />
The uneven geographical distribution of traded natural<br />
resources is further illustrated by Maps 1 to 5 in the