Glioma Multiforme Brain Tumor Segmentation using ... - IRNet Explore
Glioma Multiforme Brain Tumor Segmentation using ... - IRNet Explore
Glioma Multiforme Brain Tumor Segmentation using ... - IRNet Explore

Create successful ePaper yourself
Turn your PDF publications into a flip-book with our unique Google optimized e-Paper software.
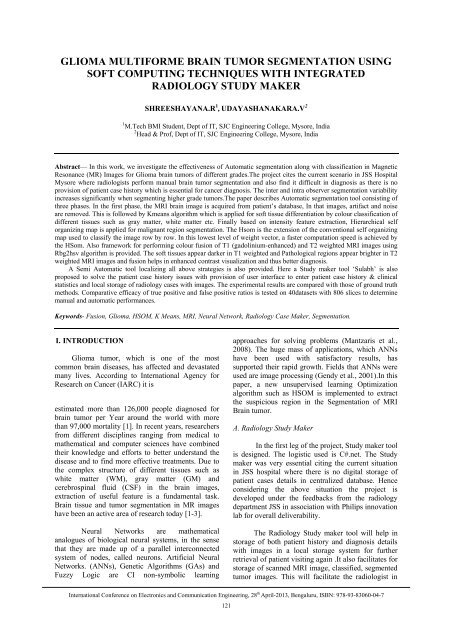
GLIOMA MULTIFORME BRAIN TUMOR SEGMENTATION USING<br />
SOFT COMPUTING TECHNIQUES WITH INTEGRATED<br />
RADIOLOGY STUDY MAKER<br />
SHREESHAYANA.R 1 , UDAYASHANAKARA.V 2<br />
1 M.Tech BMI Student, Dept of IT, SJC Engineering College, Mysore, India<br />
2 Head & Prof, Dept of IT, SJC Engineering College, Mysore, India<br />
Abstract— In this work, we investigate the effectiveness of Automatic segmentation along with classification in Magnetic<br />
Resonance (MR) Images for <strong>Glioma</strong> brain tumors of different grades.The project cites the current scenario in JSS Hospital<br />
Mysore where radiologists perform manual brain tumor segmentation and also find it difficult in diagnosis as there is no<br />
provision of patient case history which is essential for cancer diagnosis. The inter and intra observer segmentation variability<br />
increases significantly when segmenting higher grade tumors.The paper describes Automatic segmentation tool consisting of<br />
three phases. In the first phase, the MRI brain image is acquired from patient’s database, In that images, artifact and noise<br />
are removed. This is followed by Kmeans algorithm which is applied for soft tissue differentiation by colour classification of<br />
different tissues such as gray matter, white matter etc. Finally based on intensity feature extraction, Hierarchical self<br />
organizing map is applied for malignant region segmentation. The Hsom is the extension of the conventional self organizing<br />
map used to classify the image row by row. In this lowest level of weight vector, a faster computation speed is achieved by<br />
the HSom. Also framework for performing colour fusion of T1 (gadolinium-enhanced) and T2 weighted MRI images <strong>using</strong><br />
Rbg2hsv algorithm is provided. The soft tissues appear darker in T1 weighted and Pathological regions appear brighter in T2<br />
weighted MRI images and fusion helps in enhanced contrast visualization and thus better diagnosis.<br />
A Semi Automatic tool localizing all above strategies is also provided. Here a Study maker tool ‘Sulabh’ is also<br />
proposed to solve the patient case history issues with provision of user interface to enter patient case history & clinical<br />
statistics and local storage of radiology cases with images. The experimental results are compared with those of ground truth<br />
methods. Comparative efficacy of true positive and false positive ratios is tested on 40datasets with 806 slices to determine<br />
manual and automatic performances.<br />
Keywords- Fusion, <strong>Glioma</strong>, HSOM, K Means, MRI, Neural Network, Radiology Case Maker, <strong>Segmentation</strong>.<br />
I. INTRODUCTION<br />
<strong>Glioma</strong> tumor, which is one of the most<br />
common brain diseases, has affected and devastated<br />
many lives. According to International Agency for<br />
Research on Cancer (IARC) it is<br />
estimated more than 126,000 people diagnosed for<br />
brain tumor per Year around the world with more<br />
than 97,000 mortality [1]. In recent years, researchers<br />
from different disciplines ranging from medical to<br />
mathematical and computer sciences have combined<br />
their knowledge and efforts to better understand the<br />
disease and to find more effective treatments. Due to<br />
the complex structure of different tissues such as<br />
white matter (WM), gray matter (GM) and<br />
cerebrospinal fluid (CSF) in the brain images,<br />
extraction of useful feature is a fundamental task.<br />
<strong>Brain</strong> tissue and tumor segmentation in MR images<br />
have been an active area of research today [1-3].<br />
Neural Networks are mathematical<br />
analogues of biological neural systems, in the sense<br />
that they are made up of a parallel interconnected<br />
system of nodes, called neurons. Artificial Neural<br />
Networks. (ANNs), Genetic Algorithms (GAs) and<br />
Fuzzy Logic are CI non-symbolic learning<br />
approaches for solving problems (Mantzaris et al.,<br />
2008). The huge mass of applications, which ANNs<br />
have been used with satisfactory results, has<br />
supported their rapid growth. Fields that ANNs were<br />
used are image processing (Gendy et al., 2001).In this<br />
paper, a new unsupervised learning Optimization<br />
algorithm such as HSOM is implemented to extract<br />
the suspicious region in the <strong>Segmentation</strong> of MRI<br />
<strong>Brain</strong> tumor.<br />
A. Radiology Study Maker<br />
In the first leg of the project, Study maker tool<br />
is designed. The logistic used is C#.net. The Study<br />
maker was very essential citing the current situation<br />
in JSS hospital where there is no digital storage of<br />
patient cases details in centralized database. Hence<br />
considering the above situation the project is<br />
developed under the feedbacks from the radiology<br />
department JSS in association with Philips innovation<br />
lab for overall deliverability.<br />
The Radiology Study maker tool will help in<br />
storage of both patient history and diagnosis details<br />
with images in a local storage system for further<br />
retrieval of patient visiting again .It also facilitates for<br />
storage of scanned MRI image, classified, segmented<br />
tumor images. This will facilitate the radiologist in<br />
International Conference on Electronics and Communication Engineering, 28 th April-2013, Bengaluru, ISBN: 978-93-83060-04-7<br />
121
<strong>Glioma</strong> <strong>Multiforme</strong> <strong>Brain</strong> <strong>Tumor</strong> <strong>Segmentation</strong> <strong>using</strong> Soft Computing Techniques with Integrated Radiology Study Maker<br />
diagnosis as all three image slices can be viewed in<br />
the image viewer provided.<br />
Fig 1: Use Case Diagram Sulabh-Study Maker<br />
II. MEDICAL BACKGROUND<br />
The brain is a soft, spongy mass of nerve cells<br />
and supportive tissue connected to the spinal cord. A<br />
brain tumor takes up space within the skull and<br />
interferes with normal brain activity. A tumor can<br />
cause damage by increasing pressure in the brain,<br />
shifting the brain or pushing against the skull, and<br />
invading and damaging nerves and healthy brain<br />
Tissue [4].<br />
Primary brain tumors originate in the brain<br />
itself & usually do not spread from the brain to other<br />
parts of the body. A brain tumor that develops from<br />
glial cells is called a <strong>Glioma</strong>. About one third of all<br />
primary brain and other nervous system tumors form<br />
from glial cells. <strong>Glioma</strong>s tend to grow in the cerebral<br />
hemispheres, but may also occur in the brain stem,<br />
optic nerves, spinal cord, and Cerebellum. <strong>Glioma</strong> is<br />
further divided into glial and non glial tumors. Glial<br />
includes Astrocytoma which is classified into four<br />
grades Grade I- Pilocytic Astrocytoma, Grade II-<br />
Low-Grade Astrocytoma, Grade III-Anaplastic<br />
Astrocytoma, Grade IV- Glioblastoma (or GBM) is<br />
the most invasive type of glial tumor which Grows<br />
rapidly and commonly spreads to nearby tissue. Non<br />
glial <strong>Tumor</strong>s include CNS Lymphoma, Meningioma,<br />
Schwannoma etc.<br />
Fig 2: Radiology Study Maker Sulabh Main Window<br />
Fig 4. a) Axial T2-weighted image of low-grade glioma in the<br />
right hemisphere, showing the lesion as a bright area of highsignal<br />
intensity.<br />
b) The same glioma on a T1- weighted image with contrast<br />
enhancement<br />
III. RELATED WORKS<br />
Fig 3: Radiology Study Maker Sulabh Multi Image viewer<br />
option with scanned and classified slices. Provision to enter<br />
patient clinical statistics, diagnosis, history, Discussion<br />
interface with teaching window provision.<br />
B. <strong>Glioma</strong> <strong>Brain</strong> tumor <strong>Segmentation</strong> Tool<br />
In the second leg of the project, a case study<br />
tool is provided where radiologist can classify and<br />
delineate the brain tumor region. The image can be<br />
just dragged and dropped into the study maker tool<br />
where doctor can visualize both normal and<br />
pathological images<br />
Automatic detection and segmentation of brain<br />
tumor from brain MR images offer a mechanism for<br />
overcoming the tedium involved in the manual<br />
segmentation of large datasets. But automated<br />
systems have significant problems to achieve these<br />
objectives. The major problems are pixel intensities<br />
violate the independent and identically distributed<br />
assumption within and between images due to the<br />
nature of brain MR images, and presence of a<br />
significant amount of artifacts and intensity in<br />
homogeneity in MR images [5, 6].<br />
Many techniques have been proposed to automate<br />
the brain tumor detection and segmentation in recent<br />
Years. The proposed methods can be broadly<br />
International Conference on Electronics and Communication Engineering, 28 th April-2013, Bengaluru, ISBN: 978-93-83060-04-7<br />
122
<strong>Glioma</strong> <strong>Multiforme</strong> <strong>Brain</strong> <strong>Tumor</strong> <strong>Segmentation</strong> <strong>using</strong> Soft Computing Techniques with Integrated Radiology Study Maker<br />
classified into two, intelligent based and nonintelligent<br />
based. The notable intelligent based<br />
systems are artificial neural network, fuzzy c-means,<br />
support vector machine and hybrid methods. On the<br />
other hand, most notable non-intelligent methods<br />
include thresholding and region growing.<br />
A survey on available thresholding techniques is<br />
provided on [7].Most recently, Anam Mustaqeem, Ali<br />
Javed and Tehseen Fathima in [2012] proposed<br />
thresholding based tumor detection and segmentation<br />
methods which integrated with watershed and<br />
histogram analysis . But, these papers did not specify<br />
the data used for testing and validating their methods.<br />
Region growing is not often used alone because it is<br />
not sufficient to segment brain structures accurately<br />
and robustly. In Kai Xie, Jie Yang, Z.G. Zhang et.al<br />
[2005] region growing is integrated with boundary<br />
information by a level set technique.<br />
A through treatment of neural networks can be<br />
found in [8]. Neural networks due to their ability of<br />
learning and generalization have attracted many<br />
researchers in medical image segmentation and for<br />
other image processing techniques by M. Egmont-<br />
Petersen, D. de Ridder and H. Handel’s et.al [2002].<br />
There are two main general types of learning in<br />
machine learning algorithms: supervised learning,<br />
unsupervised learning. In supervised Learning<br />
algorithms, such as Multi-Layer Perceptrons (MLP or<br />
NN), K-Nearest Neighbors (KNN), Support Vector<br />
Machine (SVM), Decision Tree (DT) to mention a<br />
few, the learning algorithm is given a labelled set of<br />
training data or examples. These labelled examples<br />
are the training set that the program tries to learn<br />
about or learn how to map the input data to the<br />
desired output. In unsupervised learning, a set of<br />
examples are given, but no labels are provided.<br />
Instead it is up to the learner to find the pattern or<br />
discover the groups. Unsupervised learning<br />
algorithms includes: Self-Organizing Maps (SOM),<br />
hierarchical clustering, K-means and fuzzy c-means<br />
clustering algorithms.<br />
Logeswari and Karnan in [9] used hierarchical<br />
self organizing map (HSOM), which is the extension<br />
of conventional SOM, to detect and visualize a brain<br />
tumor. Algorri and Flores-Mangas have used fuzzy<br />
parameters to segment normal brain tissue. [10].Dang<br />
Pelleg and Andrew Moore have proposed a new<br />
Accelerated K-Means algorithm. [11]<br />
IV AUTOMATIC SEGMENTATION METHOD<br />
Here we propose accelerated Kmeans algorithm<br />
which is adopted for Classification of soft tissues and<br />
faster Hierarchical self organizing map algorithm is<br />
developed for tumor segmentation.<br />
A. Image Acquisition<br />
Is through 1.5 Tesla Magnetom Siemens Magnetic<br />
Resonance scanner which offers the possibility to<br />
acquire256*256*58(0.86 mm, 0.86 mm, 2.5 mm) T1<br />
weighted images with the fast spin echo protocol (TR<br />
= 400, TE =16 ms, FOV = 220*220 mm) in 3 min and<br />
40 s.<br />
B. Image pre-process, Classification & segmentation<br />
• Noise removal is done through median filtering<br />
to preserve edges and suppress surgical<br />
instruments, hand movement, radio frequency<br />
noise etc<br />
• Intensity feature is extracted <strong>using</strong> mean,<br />
Std.deviation. K means algorithm classifies<br />
and provides tumor clusters and tissue<br />
differentiation.<br />
• Hsom segments region of interest based on<br />
winning neuron index of the weighted vector.<br />
C. Overview of proposed work<br />
1. Hsom Method Overview<br />
A Hierarchical self-organizing map consists of<br />
components called nodes or neurons. Associated with<br />
each node is a weight vector of the same dimension as<br />
the input data vectors and a position in the map space.<br />
The Hsom describes a mapping from a higher<br />
dimensional input space to a lower dimensional map<br />
space. The procedure for placing a vector from data<br />
space onto the map is to find the node with the closest<br />
weight vector to the vector taken from data space and<br />
to assign the map coordinates of this node to our<br />
vector. Euclidean distance to all weight vectors is<br />
computed. The neuron with weight vector most<br />
similar to the input is called the best matching unit.<br />
The update formula for a neuron with weight vector:<br />
Wv(i) is Wv(i + 1) = Wi(i+1) = wi(i) + hci(I)*[(x(i) -<br />
w(i))] (1)<br />
Here hci is neighbourhood function to calculate it<br />
h (i) = h (rc-r1)*a (i)*alpha (2)<br />
Here rc-r1=current neuron-next current neuron<br />
a (i) = sigma 0 * exp (-i/nsm) (3)<br />
2. K means Method overview<br />
The algorithm which follows for the k-means<br />
classification is given below:<br />
The <strong>Tumor</strong> cluster centres are obtained by<br />
minimising the objective function<br />
Where there are k clusters Si, i= 1, 2,…..k and μi<br />
is the centroid or mean point of all the points xi Si<br />
1. Initialise the centroids with k random values.<br />
International Conference on Electronics and Communication Engineering, 28 th April-2013, Bengaluru, ISBN: 978-93-83060-04-7<br />
123
<strong>Glioma</strong> <strong>Multiforme</strong> <strong>Brain</strong> <strong>Tumor</strong> <strong>Segmentation</strong> <strong>using</strong> Soft Computing Techniques with Integrated Radiology Study Maker<br />
2. Repeat the following steps until the <strong>Tumor</strong><br />
cluster labels of the image does not change anymore.<br />
3. For each data point, we calculate the Euclidean<br />
distance from the data point to the mean of each<br />
cluster.<br />
C (i) = arg min ||x (i)-μj|| ²<br />
If the data point is not closest to its own tumor<br />
cluster, it will have to be shifted into the closest<br />
cluster. If the data point is already closest to its own<br />
cluster, we will not shift it.<br />
4. Compute the new centroid for each of the<br />
<strong>Tumor</strong> clusters.<br />
μi = Σ {c(i) = j}x(i) / Σ {c(i) = j}<br />
Where k is a parameter of the algorithm (the<br />
number of clusters to be found), i iterates over the all<br />
the intensities, j iterates over all the centroids and μi<br />
are the centroid intensities.<br />
The block diagram involving the strategies employed<br />
is shown as follows.<br />
Fig 6: Main Graphical user Interface of classification and<br />
segmentation tool<br />
Fig 7: Auto segmentation tool Using Hsom and K means<br />
Algorithm.<br />
V .SEMI AUTOMATIC METHOD<br />
Implementation of semi automated novel<br />
approach contains various processing steps like<br />
resizing, image pre-processing <strong>using</strong> Gaussian low<br />
pass filtering, Sliding threshold window with<br />
malignant localization facility, and two unsupervised<br />
tissue classification methods <strong>using</strong> K means and Fcm<br />
algorithm. Kmeans algorithm steps have already been<br />
discussed. Fuzzy c means algorithm steps include<br />
• Let X=(x1, x2…xn) denotes an image with<br />
N pixels to be partitioned into c clusters,<br />
where xi represents the data. The algorithm<br />
is an iterative optimization that minimizes<br />
the cost function defined as follows:<br />
Fig 5.Flow Diagram of Auto segmentation strategy<br />
• Where µij represents the membership of<br />
pixel xj in the ith cluster, vi is the i th cluster<br />
center, and m is a constant. The parameter m<br />
controls the fuzziness of the resulting<br />
partition, and m=2 is used in this study.<br />
International Conference on Electronics and Communication Engineering, 28 th April-2013, Bengaluru, ISBN: 978-93-83060-04-7<br />
124
<strong>Glioma</strong> <strong>Multiforme</strong> <strong>Brain</strong> <strong>Tumor</strong> <strong>Segmentation</strong> <strong>using</strong> Soft Computing Techniques with Integrated Radiology Study Maker<br />
• Starting with an initial guess for each cluster<br />
centers, the FCM converges to a solution for<br />
vi representing the local minimum of the<br />
cost function. Convergence can be detected<br />
by comparing the changes in the<br />
membership function<br />
or the cluster center at two successive<br />
iteration<br />
Steps.<br />
Fig 10:.Flow Diagram of Fusion <strong>using</strong> Rgb2hsv algorithm<br />
VII. RESULT AND ANALYSIS<br />
Fig 8: Semi automated tool with various tumor localizing<br />
facilities<br />
VI. FUSION METHOD<br />
Fusion here adopts RGB2Hsv algorithm [12].The<br />
tool is provided as an additional aid to radiologist in<br />
diagnosis. Fusion helps in analysis of soft and<br />
pathological characteristics better. Soft tissues appear<br />
darker in T1 weighted and Pathological regions<br />
appear brighter in T2 weighted MRI images and<br />
fusion helps in enhanced contrast visualization and<br />
thus better diagnosis.<br />
The block diagram involving the strategies employed<br />
is shown as follows.<br />
The results are shown with tables. Only viewing<br />
at the segmented images by algorithms is not<br />
sufficient enough to evaluate the results. Four<br />
procedures- true positive ratio(TPR), false positive<br />
ratio(FPR), true negative ratio (TNR) and false<br />
negative ratio (FNR) are observed in the<br />
segmentation results for quality measurement<br />
[14].The misclassification error determines the error<br />
rate of classification while determining the tumor<br />
region. The Sensitivity and specificity determines the<br />
efficacy of positive prediction of malignancy on the<br />
subject who has been initially screened for diagnosis<br />
through MRI.<br />
TABLE 1: Technical Result estimation<br />
Hemingioblastoma<br />
Datasets<br />
240 slices of axial,<br />
sagittal and<br />
coronal T1<br />
weighted MRI<br />
Images<br />
Hemingioblastoma<br />
Adult Male(42 to<br />
59 years )<br />
12 data sets with<br />
136 slices and<br />
Adult Female(49 to<br />
62 years)<br />
10 datasets with<br />
104 slices<br />
RESULT COMPARISON<br />
Technical Efficacy %<br />
parameters<br />
comparison with<br />
ground truth<br />
images from<br />
radiologist<br />
0.0793<br />
Misclassification<br />
error<br />
True positive ratio 84.590<br />
False positive ratio 6.1011<br />
True negative ratio 93.898<br />
False negative ratio 6.1399<br />
Accuracy 94.323<br />
Sensitivity 92.394<br />
Specificity 93.898<br />
TABLE 2: Technical Result estimation Astrocytoma<br />
Grade 2 and Meningioma<br />
Fig 9:.Flow Diagram of Fusion strategy<br />
Datasets<br />
566 slices of axial,<br />
sagittal and<br />
coronal T1<br />
weighted MRI<br />
Images<br />
RESULT COMPARISON<br />
Technical<br />
parameters<br />
comparison with<br />
ground truth<br />
images from<br />
Efficacy %<br />
International Conference on Electronics and Communication Engineering, 28 th April-2013, Bengaluru, ISBN: 978-93-83060-04-7<br />
125
<strong>Glioma</strong> <strong>Multiforme</strong> <strong>Brain</strong> <strong>Tumor</strong> <strong>Segmentation</strong> <strong>using</strong> Soft Computing Techniques with Integrated Radiology Study Maker<br />
Meningioma &<br />
Astrocytoma<br />
Adult Male(47 to<br />
56 years )<br />
17 data sets with<br />
430 slices and<br />
Adult Female(52<br />
to66 years)<br />
14 datasets with<br />
136 slices<br />
ratio<br />
96<br />
95<br />
94<br />
93<br />
92<br />
91<br />
90<br />
radiologist<br />
Misclassification<br />
0.0672<br />
error<br />
True positive ratio 86.690<br />
False positive ratio 5.2019<br />
True negative ratio 92.867<br />
False negative ratio 5.1376<br />
Accuracy 95.423<br />
Sensitivity 93.394<br />
Specificity 94.898<br />
Graph Analysis<br />
Accuracy<br />
Sensitivity<br />
Specificity<br />
effectiveness of this tool from the radiologist, whom<br />
the project is cooperated with, is positive and this tool<br />
helps the radiologist in diagnosis, and treatment<br />
planning .The Study maker has also come out with<br />
positive feedbacks.<br />
REFERENCES<br />
[1]. Ferlay J, Shin HR, Bray F, Forman D, Mathers C and Parkin<br />
DM, GLOBOCAN 2008 v2.0, Cancer Incidence and<br />
Mortality Worldwide, International Agency for Research<br />
on Cancer, Lyon, France, 2010.<br />
[2]. K. M. Iftekharuddin, “On techniques in fractal analysis and<br />
their applications in brain,” Medical imaging systems:<br />
technology and applications, Analysis and Computational<br />
Methods, vol. 1, World Scientific Publications, ISBN 981-<br />
256-993-6, 2005.<br />
[3] H. S. Zadech and H. S. Windham, “Optimal linear<br />
transformation for MRI feature extraction”, IEEE Trans.<br />
Med. Imaging, vol. 15, pp. 749–767.<br />
[4] The essential guide to brain tumors-National brain tumor<br />
society.org<br />
[5]. Schmidt M. , Levner I. , Greiner R. , Murtha A. and Bistritz A,<br />
Segmenting <strong>Brain</strong> <strong>Tumor</strong>s <strong>using</strong> Alignment-Based<br />
Features, IEEE 4th International Conference on Machine<br />
Learning and Applications, ICMLA, Dec. 2005, pp. 215-220.<br />
[6]. L. J. Erasmus, D. Hurter, M. Naude, H.G. Kritzinger and S<br />
Acho, ―A short overview of MRI artifacts, SA Journal of<br />
Radiology, Vol. 8 ,No. 2 , August 2004, pp. 13-17.<br />
VIII .FUTURE WORK<br />
Fig 11:.Graph of Result Estimates<br />
Clinical effectiveness of the proposed algorithm<br />
for segmentation and fusion strategy needs to be<br />
evaluated with physician satisfaction, and other<br />
clinical related variables. In future, the system should<br />
be improved by adapting more segmentation<br />
algorithm to suit the different medical image<br />
segmentation.Further improvements after practical<br />
usage of study maker will be undertaken.<br />
IX.CONCLUSION<br />
In this paper, we show an efficient algorithm for<br />
fully automated brain tumor segmentation in <strong>Glioma</strong><br />
brain tumor images <strong>using</strong> unsupervised Hierarchical<br />
self organizing map technique. Method performs very<br />
well in extracting tumors when compared with that of<br />
the ground truth images from radiologist. However,<br />
the spreading of grade 4 tumor to different soft<br />
tissues and brain edges is a challenging task in<br />
segmentation as it may lead to misclassified brain<br />
tumor regions. Hence supervised method should also<br />
be evaluated to improve the robustness of automatic<br />
segmentation. The automatic segmentation methods<br />
and Fusion tool has been provided to aid the<br />
radiologist in better diagnosis of tumor. The<br />
[7]. Sezgin M. and Sankur B.―Survey over image thresholding<br />
techniques and quantitative performance evaluation,<br />
Journal of Electronic Imaging ,Vol. 13,No. 1 , Jan. 2004, pp.<br />
146–165.<br />
[8]. Nikola K. Kasabov, Foundations of Neural Networks, Fuzzy<br />
Systems, and Knowledge Engineering, Massachusetts<br />
Institute of Technology, 1998, pp. 167-473.<br />
[9]. T. Logeswari and M. Karnan, ―An improved implementation<br />
of brain tumor detection <strong>using</strong> segmentation based on soft<br />
computing, Journal of Cancer Research and Experimental<br />
Oncology, Vol. 2, No. 1, March 2010, pp. 006-014.<br />
[10]. M.E. Algorri, F. Flores-Mangas, Classification of anatomical<br />
structures in MR brain images <strong>using</strong> fuzzy parameters, IEEE<br />
Trans.Biomed. Eng. 51 (9) (2004) 1599–1608.<br />
[11]. Dan Pelleg, Andrew Moore-Accelerating K means<br />
Algorithms with geometric reasoning, Carnegie Mellon<br />
university special issue.<br />
[12]. “A Comparative Analysis of Fuzzy C-Means Clustering and<br />
K Means Clustering Algorithms” Mrs. Bharati R.Jipkate, Dr.<br />
Mrs.V.V.Gohokar /International Journal Of Computational<br />
Engineering Research / ISSN: 2250–3005.<br />
[13].Stokes, Michael, Matthew Anderson, Srinivasan<br />
Chandrasekar, and Ricardo Motta, "A Standard Default Color<br />
Space for the Internet – RGB." November 5, 1996.<br />
[14] B. Peng, L. Zheng and J. Yang, “Iterated Graph Cuts for<br />
Image <strong>Segmentation</strong>”, Asian Conference on Computer Vision<br />
(ACCV’09), Xi'an, China, September 23-27, 2009.<br />
[15]Microsoft Development network .Net tutorial website,<br />
www.msdn.com<br />
International Conference on Electronics and Communication Engineering, 28 th April-2013, Bengaluru, ISBN: 978-93-83060-04-7<br />
126