Opportunity Newark - Initiative for a Competitive Inner City
Opportunity Newark - Initiative for a Competitive Inner City
Opportunity Newark - Initiative for a Competitive Inner City

You also want an ePaper? Increase the reach of your titles
YUMPU automatically turns print PDFs into web optimized ePapers that Google loves.
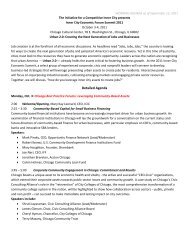
Fig. 15: Composition of <strong>Newark</strong>’s Health<br />
Services Employment<br />
Healthcare Provider<br />
Offices<br />
12%<br />
Drug Stores<br />
5%<br />
Other<br />
1%<br />
spending on all goods and services increased by 2.9 percent<br />
in 2002 and 0.3 percent in 2003. In comparison, consumer<br />
expenditures on health care increased by 7.7 percent in 2002<br />
and 2.8 percent in 2003. 51 On a per capita basis, health care<br />
spending increased by 7.4 percent in 2003 and is expected<br />
to continue to increase as the population ages. 52<br />
According to the U.S. Department of Labor’s Quarterly Census<br />
of Employment and Wages (ES-202), employment in<br />
the health sector grew at a compound annual growth rate<br />
(CAGR) of 2.72 percent nationally and 2.09 percent in <strong>Newark</strong><br />
between 1998 and 2003 (see Fig. 16). 53<br />
Home and<br />
Residential Care<br />
15%<br />
Source: ES-202, 2003<br />
Hospitals<br />
67%<br />
With more than 15,000 employees, <strong>Newark</strong>’s Health Services<br />
cluster is the second largest employer in the city. 54<br />
The local hospitals employ 67 percent of the city’s health<br />
care workers (see Fig. 15); health care provider offices and<br />
residential care facilities employ most of the remaining<br />
workers in the cluster.<br />
<strong>Newark</strong> has six hospitals and a network of primary care clinics,<br />
both associated and independent from these hospitals.<br />
This network includes the <strong>Newark</strong> Community Health Centers,<br />
four federally funded primary care facilities, as well as<br />
Fig. 16: Employment Growth in <strong>Newark</strong> Health Services Cluster<br />
12,000<br />
10,000<br />
CAGR<br />
2.0%<br />
Cluster CAGR<br />
(1998-2003) = 2.09%<br />
Employment<br />
8,000<br />
6,000<br />
4,000<br />
2,000<br />
-0.5%<br />
4.3%<br />
8.4%<br />
1998<br />
2003<br />
-3.2%<br />
Source: ES-202, 2003<br />
0<br />
Hospitals<br />
Home & Resid.<br />
Care<br />
Healthcare<br />
Provider Offices<br />
Drug<br />
Stores<br />
Other<br />
51 U.S. Bureau of Labor Statistics. Consumer Expenditures Survey in 2003. U.S. Department of Labor. 6/05.<br />
52 Healthcare: Facilities. S&P Industry Survey. 12/04.<br />
53 ICIC calculations based on U.S. Department of Labor. Quarterly Census of Employment and Wages ES-202 1998 — 2003. Note: Growth rates may differ<br />
from other estimates due to variations in time periods or the industry classifications used to define the health services cluster.<br />
54 Ibid.<br />
<strong>Opportunity</strong><strong>Newark</strong>: Jobs and Community Development <strong>for</strong> the 21st Century 36