Testing and quality
Testing and quality
Testing and quality

Create successful ePaper yourself
Turn your PDF publications into a flip-book with our unique Google optimized e-Paper software.
PANORAMA<br />
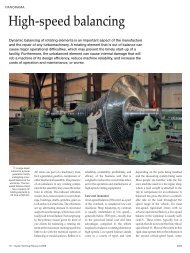
Characterization of arbitrary<br />
distributions—a new method<br />
For a realistic evaluation of an arbitrary distribution, the fluctuations of the<br />
magnitudes as well as its spatial distribution have to be considered. Therefore,<br />
a new key figure (CoD—coefficient of distribution) has been found that is able<br />
to cover both attributes of the distribution/mixture. First tests with artificial tracer<br />
distributions as well as with tracer distributions gained from CFD-calculations<br />
show reasonable results. The new key figure provides a realistic evaluation of<br />
any arbitrary distribution. The use of this powerful tool can, therefore, improve<br />
the possibilities in the design <strong>and</strong> development phase of products as well as<br />
help create more precise definitions for the requirements of the customers.<br />
30 | Sulzer Technical Review 1/2011<br />
The mixing of components is one of the<br />
oldest processes within mechanical<br />
process engineering. Industrial mixing<br />
processes are challenging—especially<br />
for liquids <strong>and</strong>, in particular, for liquids<br />
with high viscosities. Since more mixing<br />
effort is necessary to achieve better<br />
homogeneity, the characterization of the<br />
state of the mixture is of special interest.<br />
The homogeneity, or the degree of<br />
mixing, is commonly evaluated with<br />
figures that are based on statistical<br />
methods. A well-introduced <strong>and</strong><br />
commonly accepted value is the CoV,<br />
the coefficient of variation, which<br />
describes the ratio between st<strong>and</strong>ard<br />
deviation <strong>and</strong> expectation.<br />
Since the CoV value is an averaged<br />
quantity over a region (area or space)<br />
<strong>and</strong>, therefore, not sensitive to spatial<br />
differences, a quantification of mixtures<br />
only with the CoV can sometimes lead<br />
to less expressiveness or to misconstructions.<br />
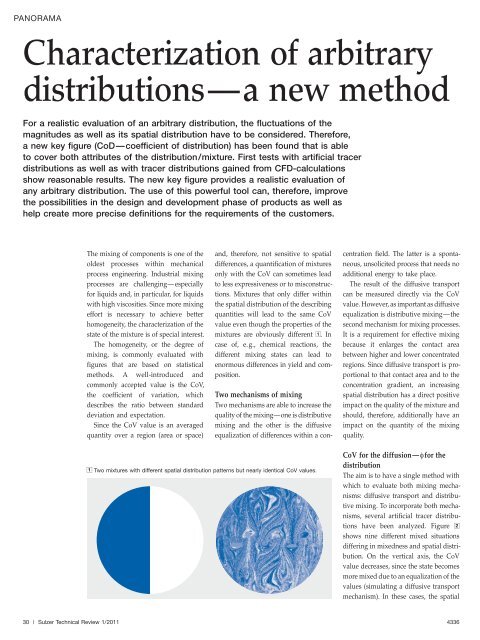
Mixtures that only differ within<br />
the spatial distribution of the describing<br />
quantities will lead to the same CoV<br />
value even though the properties of the<br />
mixtures are obviously different 1. In<br />
case of, e.g., chemical reactions, the<br />
different mixing states can lead to<br />
enormous differences in yield <strong>and</strong> composition.<br />
Two mechanisms of mixing<br />
Two mechanisms are able to increase the<br />
<strong>quality</strong> of the mixing—one is distributive<br />
mixing <strong>and</strong> the other is the diffusive<br />
equalization of differences within a con-<br />
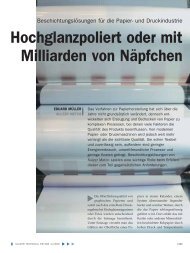
1 Two mixtures with different spatial distribution patterns but nearly identical CoV values.<br />
centration field. The latter is a spontaneous,<br />
unsolicited process that needs no<br />
additional energy to take place.<br />
The result of the diffusive transport<br />
can be measured directly via the CoV<br />
value. However, as important as diffusive<br />
equalization is distributive mixing—the<br />
second mechanism for mixing processes.<br />
It is a requirement for effective mixing<br />
because it enlarges the contact area<br />
between higher <strong>and</strong> lower concentrated<br />
regions. Since diffusive transport is proportional<br />
to that contact area <strong>and</strong> to the<br />
concentration gradient, an increasing<br />
spatial distribution has a direct positive<br />
impact on the <strong>quality</strong> of the mixture <strong>and</strong><br />
should, therefore, additionally have an<br />
impact on the quantity of the mixing<br />
<strong>quality</strong>.<br />
CoV for the diffusion—ffor the<br />
distribution<br />
The aim is to have a single method with<br />
which to evaluate both mixing mechanisms:<br />
diffusive transport <strong>and</strong> distributive<br />
mixing. To incorporate both mechanisms,<br />
several artificial tracer distributions<br />
have been analyzed. Figure 2<br />
shows nine different mixed situations<br />
differing in mixedness <strong>and</strong> spatial distribution.<br />
On the vertical axis, the CoV<br />
value decreases, since the state becomes<br />
more mixed due to an equalization of the<br />
values (simulating a diffusive transport<br />
mechanism). In these cases, the spatial<br />
4336