Creating high-resolution hail datasets using social media and post ...
Creating high-resolution hail datasets using social media and post ...
Creating high-resolution hail datasets using social media and post ...

Create successful ePaper yourself
Turn your PDF publications into a flip-book with our unique Google optimized e-Paper software.
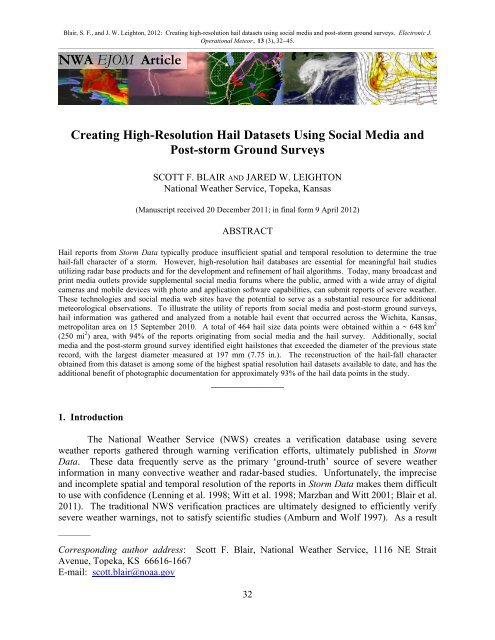
Blair, S. F., <strong>and</strong> J. W. Leighton, 2012: <strong>Creating</strong> <strong>high</strong>-<strong>resolution</strong> <strong>hail</strong> <strong>datasets</strong> <strong>using</strong> <strong>social</strong> <strong>media</strong> <strong>and</strong> <strong>post</strong>-storm ground surveys. Electronic J.<br />
Operational Meteor., 13 (3), 3245.<br />
––––––––––––––––––––––––––––––––––––––––––––––––––––––––––––––––––––––––––––––––––––––––––––––––––––––––––––––––––––<br />
NWA EJOM Article<br />
<strong>Creating</strong> High-Resolution Hail Datasets Using Social Media <strong>and</strong><br />
Post-storm Ground Surveys<br />
SCOTT F. BLAIR AND JARED W. LEIGHTON<br />
National Weather Service, Topeka, Kansas<br />
(Manuscript received 20 December 2011; in final form 9 April 2012)<br />
ABSTRACT<br />
Hail reports from Storm Data typically produce insufficient spatial <strong>and</strong> temporal <strong>resolution</strong> to determine the true<br />
<strong>hail</strong>-fall character of a storm. However, <strong>high</strong>-<strong>resolution</strong> <strong>hail</strong> databases are essential for meaningful <strong>hail</strong> studies<br />
utilizing radar base products <strong>and</strong> for the development <strong>and</strong> refinement of <strong>hail</strong> algorithms. Today, many broadcast <strong>and</strong><br />
print <strong>media</strong> outlets provide supplemental <strong>social</strong> <strong>media</strong> forums where the public, armed with a wide array of digital<br />
cameras <strong>and</strong> mobile devices with photo <strong>and</strong> application software capabilities, can submit reports of severe weather.<br />
These technologies <strong>and</strong> <strong>social</strong> <strong>media</strong> web sites have the potential to serve as a substantial resource for additional<br />
meteorological observations. To illustrate the utility of reports from <strong>social</strong> <strong>media</strong> <strong>and</strong> <strong>post</strong>-storm ground surveys,<br />
<strong>hail</strong> information was gathered <strong>and</strong> analyzed from a notable <strong>hail</strong> event that occurred across the Wichita, Kansas,<br />
metropolitan area on 15 September 2010. A total of 464 <strong>hail</strong> size data points were obtained within a ~ 648 km 2<br />
(250 mi 2 ) area, with 94% of the reports originating from <strong>social</strong> <strong>media</strong> <strong>and</strong> the <strong>hail</strong> survey. Additionally, <strong>social</strong><br />
<strong>media</strong> <strong>and</strong> the <strong>post</strong>-storm ground survey identified eight <strong>hail</strong>stones that exceeded the diameter of the previous state<br />
record, with the largest diameter measured at 197 mm (7.75 in.). The reconstruction of the <strong>hail</strong>-fall character<br />
obtained from this dataset is among some of the <strong>high</strong>est spatial <strong>resolution</strong> <strong>hail</strong> <strong>datasets</strong> available to date, <strong>and</strong> has the<br />
additional benefit of photographic documentation for approximately 93% of the <strong>hail</strong> data points in the study.<br />
_______________<br />
1. Introduction<br />
The National Weather Service (NWS) creates a verification database <strong>using</strong> severe<br />
weather reports gathered through warning verification efforts, ultimately published in Storm<br />
Data. These data frequently serve as the primary ‘ground-truth’ source of severe weather<br />
information in many convective weather <strong>and</strong> radar-based studies. Unfortunately, the imprecise<br />
<strong>and</strong> incomplete spatial <strong>and</strong> temporal <strong>resolution</strong> of the reports in Storm Data makes them difficult<br />
to use with confidence (Lenning et al. 1998; Witt et al. 1998; Marzban <strong>and</strong> Witt 2001; Blair et al.<br />
2011). The traditional NWS verification practices are ultimately designed to efficiently verify<br />
severe weather warnings, not to satisfy scientific studies (Amburn <strong>and</strong> Wolf 1997). As a result<br />
__________<br />
Corresponding author address:<br />
Avenue, Topeka, KS 66616-1667<br />
E-mail: scott.blair@noaa.gov<br />
Scott F. Blair, National Weather Service, 1116 NE Strait<br />
32
of the inherent low-<strong>resolution</strong> nature of Storm Data, there is a need for methods that improve the<br />
<strong>resolution</strong> in the severe weather database, especially for radar-based studies attempting to derive<br />
unique signatures from <strong>hail</strong> reports.<br />
High-<strong>resolution</strong> <strong>hail</strong> databases are essential for meaningful <strong>hail</strong> research utilizing<br />
Weather Surveillance Radar-1988 Doppler (WSR-88D; Crum <strong>and</strong> Alberty 1993) legacy <strong>and</strong><br />
dual-polarization base products, <strong>and</strong> for the development <strong>and</strong> refinement of <strong>hail</strong> algorithms. The<br />
representation of the <strong>hail</strong>-fall character of a storm increases with <strong>high</strong>-<strong>resolution</strong> <strong>hail</strong> databases.<br />
Studies utilizing these <strong>high</strong>er <strong>resolution</strong> reports are subject to minimal error compared to those<br />
only incorporating reports from Storm Data (Fig. 1). Currently, the only <strong>high</strong>-<strong>resolution</strong> <strong>hail</strong><br />
<strong>datasets</strong> that adequately identify the <strong>hail</strong>-fall character in storms originate from the Severe<br />
Hazards Analysis <strong>and</strong> Verification Experiment (SHAVE; Ortega et al. 2009) <strong>and</strong> A Hail Spatial<br />
<strong>and</strong> Temporal Observing Network Effort (HailSTONE; http://<strong>hail</strong>stoneresearch.org/). While<br />
these efforts produce a wealth of information <strong>and</strong> insight into the character of <strong>hail</strong> storms, they<br />
unfortunately operate on a limited basis <strong>and</strong> over a limited domain area.<br />
Figure 1. (a) An example of the spatial distribution of <strong>hail</strong> reports comparing <strong>high</strong>-<strong>resolution</strong><br />
(HailSTONE, green triangle) versus low-<strong>resolution</strong> (Storm Data, red circle) <strong>hail</strong> <strong>datasets</strong><br />
collected from 2000 UTC to 2030 UTC on 24 May 2011. (b) WSR-88D Oklahoma City<br />
(KTLX) 0.5 o base reflectivity image from 24 May 2011 at 2006 UTC used for reference.<br />
In today’s society, the public is armed with a wide array of mobile devices with photo<br />
<strong>and</strong> video capabilities that can easily share imagery on the Internet. Some of these technologies<br />
incorporate geotagging, which allows for location-specific information to be included within the<br />
imagery. Many <strong>media</strong> outlets encourage users to submit weather photos to their respective <strong>social</strong><br />
<strong>media</strong> forums during weather events, resulting in an abundance of public weather-related<br />
information. In many cases, without this collection of <strong>social</strong> <strong>media</strong> information, the<br />
meteorological community would have insufficiently documented severe weather events <strong>and</strong><br />
other weather phenomena (Hyvärinen <strong>and</strong> Saltikoff 2010). While the initial intentions of <strong>social</strong><br />
<strong>media</strong> weather information are generally not aimed at scientific research, these observations in a<br />
quality-controlled environment have the potential to serve as a substantial resource in severe<br />
storm verification. This paper illustrates the utility of <strong>social</strong> <strong>media</strong> reports <strong>and</strong> additional<br />
33
verification efforts as resources in creating a <strong>high</strong>-<strong>resolution</strong> <strong>hail</strong> dataset from a notable <strong>hail</strong><br />
event that occurred across the Wichita, Kansas, metropolitan area on 15 September 2010.<br />
2. Hail data <strong>and</strong> methodology<br />
a. Case example: 15 September 2010<br />
On 15 September 2010, deep convection initiated over Reno County, Kansas, at<br />
approximately 2030 UTC. One long-lived supercell moved southeastward through portions of<br />
south-central Kansas over a 5-h period, impacting thous<strong>and</strong>s of residents, including a large<br />
portion of the Wichita metropolitan area (Fig. 2). Most notably, the supercell produced an<br />
expansive swath of significant <strong>hail</strong> (diameter ≥ 51 mm; ≥ 2.00 in.) across both urban <strong>and</strong> rural<br />
areas. Additionally, the storm produced five EF-0 tornadoes in Sedgwick <strong>and</strong> Cowley Counties.<br />
Figure 2. A time series composite of 0.5 o base reflectivity from the Wichita, Kansas (KICT),<br />
WSR-88D from 2112 UTC 15 September 2010 to 0030 UTC 16 September 2010.<br />
Residents identified a giant <strong>hail</strong>stone (hereafter referred to as the “Wichita stone”) in the<br />
western suburbs of Wichita that had a maximum diameter of 197 mm (7.75 in.). The State<br />
Climate Extremes Committee (SCEC) certified the Wichita stone as the new state record<br />
diameter <strong>hail</strong>stone, exceeding the previous record of 144 mm (5.67 in.) that occurred in<br />
Coffeyville, Kansas, on 3 September 1970 (Fig. 3). The individuals who retrieved the Wichita<br />
stone took diameter measurements within 30 minutes of occurrence. In diameter, the Wichita<br />
stone ranks as the second largest verifiable United States <strong>hail</strong>stone to date. Table 1 lists the<br />
“Top 5” verifiable <strong>hail</strong> stones, derived from <strong>hail</strong> reports with valid photographic evidence or<br />
34
confirmed through a review process of the SCEC. An initial assessment from the <strong>hail</strong> event in<br />
Sedgwick County estimates $150 million in damages, with more than 35,000 claims turned in to<br />
insurance agencies (NCDC 2010).<br />
Table 1. The “Top 5” largest verifiable <strong>hail</strong> stones by diameter in the United States. The rank,<br />
event location <strong>and</strong> date, maximum diameter <strong>and</strong> circumference, <strong>and</strong> a photo of the <strong>hail</strong>stone are<br />
listed below for each entry. An asterisk denotes measurements made after nontrivial melting<br />
occurred.<br />
35
Figure 3. The (a) Wichita, Kansas, <strong>hail</strong>stone from 15 September 2010 with a maximum<br />
diameter of 197 mm (7.75 in.) compared to the (b) Coffeyville, Kansas, <strong>hail</strong>stone from 3<br />
September 1970 with a maximum diameter of 144 mm (5.67 in.).<br />
The data collected from the 15 September 2010 case incorporated all known available<br />
sources that contained <strong>hail</strong> information within the study domain, a 648 km 2 (250 mi 2 ) area<br />
centered over western Wichita, Kansas, that included the surrounding communities of Andale,<br />
Derby, Garden Plain, <strong>and</strong> Goddard. Hail data originated from three main sources: a) NWS local<br />
storm reports (LSRs), b) a <strong>post</strong>-storm ground survey, <strong>and</strong> c) several <strong>social</strong> <strong>media</strong> related web<br />
sites. The <strong>hail</strong> data were compiled in an Excel spreadsheet <strong>and</strong> imported into the Environmental<br />
Systems Research Institute’s (ESRI) ArcMap by adding the latitude <strong>and</strong> longitude columns as x–<br />
y data. These data were then graphically depicted through an inverse distance weighted<br />
interpolation. The geographic information system (GIS) based maps of all <strong>hail</strong> reports collected<br />
provided tremendous insight into the <strong>hail</strong>-fall character of the storm.<br />
b. NWS <strong>hail</strong> reports<br />
To begin the construction of the <strong>hail</strong> database, NWS LSRs from 15 September 2010 were<br />
compiled. LSRs were utilized in place of Storm Data due to the <strong>high</strong>er number of available <strong>hail</strong><br />
size data points. With this particular event, a single data entry in Storm Data incorporated many<br />
of the <strong>hail</strong> LSRs, providing only a start <strong>and</strong> end location of a singular swath of maximum <strong>hail</strong><br />
size. Specific <strong>hail</strong> size information from the report location, including an improved temporal<br />
<strong>resolution</strong>, was available from the LSRs, making them the most attractive option in this case.<br />
Information that was collected from LSRs included the report time, measured or estimated<br />
maximum diameter <strong>hail</strong> size, <strong>and</strong> the location of the report.<br />
c. Post-storm ground survey<br />
A <strong>post</strong>-storm ground survey was conducted on 16 September 2010 after the NWS in<br />
Wichita, Kansas (NWS ICT) received several reports of giant <strong>hail</strong> (diameter ≥ 102 mm; ≥ 4.00 in.),<br />
36
including the Wichita stone. The objectives of the survey were to (1) assist NWS ICT with official<br />
measurements of the Wichita stone, (2) potentially identify any <strong>hail</strong> sizes larger than the Wichita<br />
stone, <strong>and</strong> (3) acquire additional <strong>hail</strong> reports within <strong>and</strong> in close proximity to the areas impacted by<br />
the largest <strong>hail</strong> in order to improve the report <strong>resolution</strong> for a separate radar-based study (Blair et<br />
al. 2011). A 24-km (15-mi.) long path of both rural <strong>and</strong> urban areas was surveyed from Garden<br />
Plain to the Wichita Mid-Continent Airport, including several subdivisions on the western side of<br />
Wichita. In the event that residents preserved <strong>hail</strong> in their freezers, the authors measured <strong>and</strong><br />
recorded the diameter, circumference, <strong>and</strong> weight of each stone (Fig. 4). The authors also inquired<br />
whether residents made any <strong>hail</strong> reports to local authorities, <strong>media</strong>, or the NWS. Photographs were<br />
taken of each <strong>hail</strong>stone measured <strong>and</strong> the location was recorded.<br />
Figure 4. An example of <strong>hail</strong>stones identified during the <strong>post</strong>-storm ground survey that were<br />
preserved by residents in the Wichita, Kansas, metropolitan area.<br />
d. Social <strong>media</strong><br />
To supplement the reports obtained by the <strong>post</strong>-storm survey <strong>and</strong> NWS LSRs, <strong>hail</strong><br />
information was gathered from eight different web-based <strong>social</strong> <strong>media</strong> outlets (Table 2). These<br />
web-based sources included local <strong>and</strong> national television stations, local print <strong>media</strong>, <strong>and</strong><br />
dedicated <strong>social</strong> <strong>media</strong> sites that allowed video- <strong>and</strong> photo-sharing capabilities. In the context of<br />
this paper, <strong>social</strong> <strong>media</strong> are defined as interactive forums through which users could upload<br />
photos or video, share details, <strong>and</strong> view <strong>and</strong> comment on other’s experiences from a particular<br />
event. The information contained within these <strong>social</strong> <strong>media</strong> pages provided the framework to<br />
document <strong>and</strong> record <strong>high</strong> spatial <strong>resolution</strong> <strong>hail</strong> information. The maximum diameter <strong>hail</strong> size<br />
was derived from each photo <strong>and</strong> video, <strong>using</strong> a 6.4-mm (0.25 in.) <strong>resolution</strong>. The majority of<br />
user-provided images compared the <strong>hail</strong>stone next to commonly-sized objects, tape measures, or<br />
rulers. For imagery that included no st<strong>and</strong>ard size comparison but included less traditional<br />
objects such as household or outdoor items, an estimated size was recorded. In the event that the<br />
<strong>hail</strong>stone was shown with no discernable object for size comparison, the report was removed<br />
37
from the database. Some inherent subjectivity was necessary for classifying specific maximum<br />
diameter <strong>hail</strong> sizes from amateur photos <strong>and</strong> videos, <strong>and</strong> additional uncertainty during the <strong>hail</strong><br />
size classification stemmed from potential parallax errors. The size of the parallax error<br />
depended on the height <strong>and</strong> location of the <strong>hail</strong>stone relative to the camera lens. Individual cases<br />
were removed from the database when an approximate <strong>hail</strong> size could not be resolved due to<br />
considerable parallax errors. While the aforementioned methods of determining the maximum<br />
<strong>hail</strong> stone diameter allowed some uncertainty in the database with respect to the approximated<br />
diameters, the authors contend the data quality as a whole is likely superior to telephone-based<br />
reports of estimated <strong>hail</strong> sizes from the public due to the availability of photographic evidence<br />
<strong>and</strong> a consistent method for each case.<br />
Table 2. Social <strong>media</strong> sources incorporated in the study that contained specific <strong>hail</strong> information<br />
from 15 September 2010.<br />
1) BROADCAST MEDIA, PRINT MEDIA, FACEBOOK, AND TWITTER<br />
Interactive photo galleries supplemented traditional broadcast <strong>and</strong> print <strong>media</strong> web pages<br />
in the Wichita metropolitan area. In these galleries, users were able to upload one or more<br />
photos of the event with the option to include a brief narrative caption (Fig. 5). There was also a<br />
section where individuals could leave comments about the images <strong>post</strong>ed. Facebook <strong>and</strong> Twitter<br />
pages had a similar design of information-sharing. The authors searched for <strong>hail</strong> photos on the<br />
NWS Wichita Skywarn Facebook page, <strong>and</strong> on Twitter <strong>using</strong> the “hashtag” designation<br />
“#ksstorms.” Each available photo was preserved, <strong>and</strong> data derived from the photos <strong>and</strong><br />
narratives were recorded <strong>and</strong> entered into the database.<br />
Photo captions frequently identified the location of the photographer, either by listing the<br />
intersection of two roadways or explicitly defining the address. In other cases it appeared that<br />
the photographers periodically approximated the location of the photograph <strong>using</strong> recognizable<br />
roadway intersections or l<strong>and</strong>marks closest to their respective location. Google Earth was<br />
utilized to locate the latitude <strong>and</strong> longitude coordinates of the specified <strong>hail</strong> location in the photo<br />
38
caption, <strong>and</strong> this information was quality controlled to determine if the provided location was<br />
reasonably accurate. In cases where no caption was listed or the address was unclear, the user’s<br />
photo was removed from the database.<br />
Figure 5. An example of <strong>hail</strong> photos uploaded by users on the KAKE <strong>social</strong> <strong>media</strong> photo forum<br />
from 15 September 2010.<br />
39
2) YOUTUBE<br />
The video sharing website YouTube (http://www.youtube.com) was interrogated for<br />
videos related to the 15 September 2010 <strong>hail</strong> storm. An initial search for “giant <strong>hail</strong> Wichita”<br />
was performed to identify videos taken <strong>and</strong> uploaded by residents <strong>and</strong> storm chasers, <strong>and</strong> videos<br />
of this event resulting from the search were then examined until all original videos were<br />
exhausted. Each YouTube account holder that uploaded a video from the <strong>hail</strong> storm was<br />
contacted with a request to provide the approximate time of the <strong>hail</strong>, the location where the video<br />
was taken, <strong>and</strong> the largest diameter of the <strong>hail</strong> in the video. The resulting information from this<br />
correspondence was utilized in the database.<br />
3. Results <strong>and</strong> discussion<br />
a. Reports, survey, <strong>and</strong> <strong>social</strong> <strong>media</strong><br />
1) NWS HAIL REPORTS<br />
NWS LSRs accounted for 30 <strong>hail</strong> reports within the study domain. However, several of<br />
the report locations contained multiple reports of varying <strong>hail</strong> sizes as either stones became<br />
larger at a given area with time, or geographical-coordinated estimates placed reports in similar<br />
locations. Therefore, only 13 unique locations containing a maximum diameter <strong>hail</strong> size were<br />
produced from the LSRs.<br />
2) POST-STORM GROUND SURVEY<br />
The NWS <strong>post</strong>-storm ground survey established contact with 60 residents across the<br />
western sections of the Wichita metropolitan area. Approximately 80% of the surveyed residents<br />
preserved <strong>hail</strong>stones in their freezers. While some individuals placed <strong>hail</strong> in sealed plastic bags,<br />
the majority left stones exposed to the effects of sublimation. The residents indicated that the<br />
primary motivating factor of keeping the <strong>hail</strong>stones was for insurance purposes. Some<br />
individuals that preserved the stones also indicated that they did not collect the largest <strong>hail</strong> they<br />
observed. All stones saved by the residents had diameters ≥ 64 mm (≥ 2.50 in.), with a <strong>media</strong>n<br />
size of 102 mm (4.00 in.). The <strong>high</strong> number of individuals found from the survey that saved<br />
<strong>hail</strong>stones yields some promise for future <strong>post</strong>-storm verification efforts in which residents may<br />
be able to provide accurate measurements of <strong>hail</strong> if explicitly prompted to do so.<br />
Significant property damage was observed over the surveyed areas. The most impressive<br />
damage from <strong>hail</strong> impacts consisted of punctured automobile windows, large impact craters on<br />
the ground, <strong>and</strong> plywood roofs <strong>and</strong> wooden decks penetrated by giant <strong>hail</strong>.<br />
A substantial find from the ground assessment was that no surveyed individuals contacted<br />
the NWS to report <strong>hail</strong> information, while approximately 2% reported a <strong>hail</strong> size to local<br />
authorities <strong>and</strong> 5% made reports to the <strong>media</strong> by phone or <strong>social</strong> <strong>media</strong>. These values illustrate<br />
the challenge of receiving real-time <strong>hail</strong> reports that provide an accurate assessment of the<br />
maximum <strong>hail</strong> size occurring in a storm, even in situations when <strong>high</strong>ly urban l<strong>and</strong>scapes are<br />
affected by significant <strong>hail</strong>. While the 5% of individuals reporting <strong>hail</strong> sizes to the <strong>media</strong><br />
appears to be a low percentage, it emphasizes the contributing role that <strong>social</strong> <strong>media</strong> could play<br />
40
in providing additional verification information that would otherwise not be reported to a local<br />
NWS office.<br />
3) SOCIAL MEDIA<br />
Web-based <strong>social</strong> <strong>media</strong> sources accounted for 387 <strong>hail</strong> reports. Approximately 90% of<br />
the <strong>social</strong> <strong>media</strong>-based <strong>hail</strong> photos with a narrative caption originated from the three Wichita<br />
television broadcast station web pages. A <strong>hail</strong> size distribution of the <strong>social</strong> <strong>media</strong> reports<br />
revealed some insight into the reporting behavior of local residents (Fig. 6). The size distribution<br />
of <strong>hail</strong> reports obtained from photographic evidence deviates from traditional NWS verification<br />
practices that tend to bias <strong>hail</strong> sizes to commonly-sized objects or coins (Jewell <strong>and</strong> Brimelow<br />
2009). The data also allow for some speculation that residents uploaded <strong>hail</strong> photos they felt<br />
were noteworthy to share, perhaps the largest <strong>hail</strong>stone within their proximity. It is interesting to<br />
note that only 3% of the uploaded photos contained <strong>hail</strong> smaller than the size of golf balls<br />
(44.5 mm; 1.75 in.) even though it is suspected that many urban locations, especially in the<br />
northeastern portion of the Wichita metropolitan area, received <strong>hail</strong> of this size. It is unknown<br />
whether the lack of reporting smaller <strong>hail</strong> sizes was a function of 1) a regional bias where large<br />
<strong>hail</strong> occurs more frequently <strong>and</strong> therefore smaller <strong>hail</strong> seems less notable, 2) a storm-specific<br />
bias where the coverage of significant <strong>hail</strong> in this storm was substantial <strong>and</strong> widespread, or 3) a<br />
seasonal bias where small <strong>hail</strong> during the convective season appears commonplace. More cases<br />
where <strong>social</strong> <strong>media</strong> plays a prominent role in <strong>hail</strong> verification will be required to assess the<br />
public’s reporting behavior of <strong>hail</strong> sizes, <strong>and</strong> their perception of what constitutes a ‘severe-sized’<br />
<strong>hail</strong>stone.<br />
Figure 6. Normalized (%) <strong>hail</strong> size distribution (in.) of <strong>social</strong> <strong>media</strong> reports from 15 September<br />
2010.<br />
41
. Recreating the <strong>hail</strong>-fall character<br />
A total of 464 <strong>hail</strong> data points were collected from all available sources <strong>and</strong> incorporated<br />
into the database (Fig. 7). Social <strong>media</strong> information accounted for 83% of the reports, while<br />
10% of the data points originated from the <strong>post</strong>-storm ground survey, <strong>and</strong> 7% of the points were<br />
from NWS LSRs. Approximately 93% of all the <strong>hail</strong> data points had accompanying photos of<br />
the maximum diameter <strong>hail</strong>stones. Hail reports with photographic documentation are superior to<br />
traditional reports, as the imagery helps mitigate uncertainty in the quality <strong>and</strong> validity of each<br />
<strong>hail</strong> data point. The tremendous number of available <strong>hail</strong> data points allowed for a <strong>high</strong> spatial<br />
<strong>resolution</strong> graphical reconstruction of the <strong>hail</strong>-fall character of the storm through time (Fig. 8).<br />
While an analysis of the <strong>hail</strong>-fall relative to radar-based signatures is beyond the scope of the<br />
paper, Figure 8 shows a decrease in the maximum <strong>hail</strong> size over time as the storm moved across<br />
the study domain, which would not have been apparent <strong>using</strong> only LSRs or Storm Data. This<br />
<strong>resolution</strong> of information is critical to accurately gauge <strong>hail</strong>-fall behavior <strong>and</strong> to help<br />
discriminate sensitive storm-scale changes that may be observed operationally by warning<br />
forecasters.<br />
Figure 7. Locations of 464 <strong>hail</strong> data points from NWS LSRs (green dots), the <strong>post</strong>-storm <strong>hail</strong><br />
survey (red dots), <strong>and</strong> <strong>social</strong> <strong>media</strong> (blue dots) utilized in the study. Urban areas (yellow) of the<br />
Wichita, Kansas, metropolitan area, primary Interstates (red lines), <strong>and</strong> state <strong>high</strong>ways (blue<br />
lines) are shown for reference.<br />
42
Eight <strong>hail</strong> stones, identified from the NWS <strong>post</strong>-storm ground survey <strong>and</strong> the search<br />
through <strong>social</strong> <strong>media</strong>-based web pages, exceeded the previous Kansas record diameter stone of<br />
144 mm (5.67 in.). The residents that discovered the Wichita stone uploaded an image of the<br />
stone to one of the local television station’s <strong>social</strong> <strong>media</strong>-based photo forums, <strong>and</strong> the station<br />
promptly shared the information with the NWS ICT during the ongoing severe weather event. It<br />
is worthy to note how important of a role such technologies served to document <strong>hail</strong>stones of this<br />
magnitude. While giant <strong>hail</strong> is a relatively rare phenomenon based on records in Storm Data, it<br />
has likely been underreported in the past (Blair et al. 2011). Table 1 reveals that the seven<br />
largest verifiable United States <strong>hail</strong>stones have occurred since 2003. Thus, it is reasonable to<br />
conclude more <strong>high</strong>-end <strong>hail</strong> events will continue to be documented as photo-sharing<br />
technologies become more widespread <strong>and</strong> utilized by the public <strong>and</strong> the meteorological<br />
community.<br />
Figure 8. Inverse distance weighted interpolation from 464 <strong>hail</strong> data points. Color-filled<br />
contours correspond to one-inch increments of <strong>hail</strong> size. Urban areas (black outline) of the<br />
Wichita, Kansas, metropolitan area, primary Interstates (red lines), <strong>and</strong> state <strong>high</strong>ways (blue<br />
lines) are shown for reference.<br />
4. Summary<br />
A <strong>high</strong>-<strong>resolution</strong> <strong>hail</strong> dataset was created from a prolific giant <strong>hail</strong>-producing supercell<br />
that impacted portions of the Wichita, Kansas, metropolitan area on 15 September 2010. The<br />
storm provided a unique opportunity to create very <strong>high</strong>ly-spatially-resolved information within<br />
43
an urban <strong>and</strong> rural l<strong>and</strong>scape, derived from supplemental <strong>hail</strong> data not available from Storm<br />
Data. The three main sources of <strong>hail</strong> data were NWS LSRs, a <strong>post</strong>-storm ground survey, <strong>and</strong><br />
<strong>social</strong> <strong>media</strong>-related web sites. A total of 464 <strong>hail</strong> data points were collected <strong>and</strong> incorporated<br />
into the database, with 83% of the reports stemming from <strong>social</strong> <strong>media</strong> web sites.<br />
Approximately 93% of the data points had accompanying photos of the maximum diameter<br />
<strong>hail</strong>stones, mitigating some of the size errors <strong>and</strong> biases associated with typical public-based <strong>hail</strong><br />
reports.<br />
The NWS <strong>post</strong>-storm ground survey <strong>and</strong> <strong>social</strong> <strong>media</strong> data uncovered several useful<br />
findings. The survey found that approximately 80% of the sampled residents preserved<br />
<strong>hail</strong>stones in freezers, primarily for insurance purposes. Additionally, the survey showed the<br />
challenge of receiving <strong>hail</strong> reports from the public. None of the surveyed residents reported <strong>hail</strong><br />
to the NWS, while approximately 7% contacted local authorities or the <strong>media</strong>. While this<br />
illustrates the challenge of receiving <strong>hail</strong> reports <strong>using</strong> traditional verification methods even<br />
when extraordinarily large <strong>hail</strong>stones occur in urban areas, the survey showed that <strong>social</strong> <strong>media</strong><br />
outlets, especially those operated by local television stations, can be a significant source for<br />
obtaining additional severe weather reports. Lastly, the <strong>post</strong>-storm ground survey <strong>and</strong> searches<br />
through the Wichita-based <strong>social</strong> <strong>media</strong> web pages identified eight <strong>hail</strong> stones that exceeded the<br />
previous Kansas record <strong>hail</strong> size diameter.<br />
Growing photo <strong>and</strong> video technologies <strong>and</strong> the usage of <strong>social</strong> <strong>media</strong> are allowing the<br />
operational <strong>and</strong> research communities to document meteorological events that would have gone<br />
unreported in the past. These data provide a meaningful contribution to the science, <strong>and</strong> are<br />
presumably available for most other notable weather phenomena. High-<strong>resolution</strong> <strong>hail</strong> data are<br />
critical to accurately represent the <strong>hail</strong>-fall behavior in a storm, in order to discriminate sensitive<br />
storm-scale changes <strong>and</strong> determine the utility of radar-based <strong>hail</strong> signatures. It is hoped that this<br />
type of supplemental <strong>hail</strong> data will be incorporated into Storm Data to improve the national <strong>hail</strong><br />
climatology database, to support additional research efforts in <strong>hail</strong> size prediction utilizing dualpolarization<br />
radar products, <strong>and</strong> in the development <strong>and</strong> refinement of new <strong>hail</strong>-related<br />
algorithms.<br />
Acknowledgements. The authors wish to recognize Jennifer Laflin (NWS Sioux Falls,<br />
SD), George Phillips (NWS Topeka, KS), Albert Pietrycha (NWS Goodl<strong>and</strong>, KS), Derek<br />
Deroche (NWS Pleasant Hill, MO), Amos Magliocco (University of North Texas), Jeff Manion<br />
(NWS Central Region Headquarters), <strong>and</strong> two anonymous NWA reviewers for their role in<br />
improving the manuscript through technical editing. We would also like to thank Ken Cook <strong>and</strong><br />
Chance Hayes (NWS Wichita, KS) for their assistance during the <strong>post</strong>-storm ground survey.<br />
Lastly, the authors thank the 2011 HailSTONE participants for their involvement in collecting<br />
data used in Fig. 1. The views expressed within this manuscript are those of the authors <strong>and</strong> do<br />
not necessarily represent those of the National Weather Service.<br />
REFERENCES<br />
Amburn, S. A. <strong>and</strong> P. L. Wolf, 1997: VIL density as a <strong>hail</strong> indicator. Wea. Forecasting, 12, 473–<br />
478.<br />
Blair, S. F., D. R. Deroche, J. M. Boustead, J. W. Leighton, B. L. Barjenbruch, <strong>and</strong> W. P.<br />
Gargan, 2011: A radar-based assessment of the detectability of giant <strong>hail</strong>. Electronic J.<br />
Severe Storms Meteor., 6 (7), 1–30.<br />
44
Crum, T. D. <strong>and</strong> R. L. Alberty, 1993: The WSR-88D <strong>and</strong> the WSR-88D operational support<br />
facility. Bull. Amer. Meteor. Soc., 74, 1669–1687.<br />
Hyvärinen, O. <strong>and</strong> E. Saltikoff, 2010: Social <strong>media</strong> as a source of meteorological observations.<br />
Mon. Wea. Rev., 138, 3175–3184.<br />
Jewell, R. <strong>and</strong> J. Brimelow, 2009: Evaluation of Alberta Hail Growth Model Using Severe Hail<br />
Proximity Soundings from the United States. Wea. Forecasting, 24, 1592–1609.<br />
Lenning, E., H. E. Fuelberg, <strong>and</strong> A. I. Watson, 1998: An evaluation of WSR-88D severe <strong>hail</strong><br />
algorithms along the northeastern Gulf Coast. Wea. Forecasting, 13, 1029–1045.<br />
Marzban, C. <strong>and</strong> A. Witt, 2001: A Bayesian neural network for severe-<strong>hail</strong> size prediction. Wea.<br />
Forecasting, 16, 600–610.<br />
NCDC, 2010: Storm Data. [Available from National Climatic Data Center, 151 Patton Ave.,<br />
Asheville, NC 28801-5001.]<br />
Ortega, K. L, T. M. Smith, K. L. Manross, K. A. Scharfenberg, A. Witt, A. G. Kolodziej, <strong>and</strong> J.<br />
J. Gourley, 2009: The severe hazards analysis <strong>and</strong> verification experiment. Bull. Amer.<br />
Meteor. Soc., 90, 1519-1530.<br />
Witt, A., M. D. Eilts, G. J. Stumpf, E. D. Mitchell, J. T. Johnson, <strong>and</strong> K. W. Thomas, 1998:<br />
Evaluating the performance of WSR-88D severe storm detection algorithms. Wea.<br />
Forecasting, 13, 513–518.<br />
45