UNIVERSITÀ DEGLI STUDI DI TRIESTE - OpenstarTs - Università ...
UNIVERSITÀ DEGLI STUDI DI TRIESTE - OpenstarTs - Università ...
UNIVERSITÀ DEGLI STUDI DI TRIESTE - OpenstarTs - Università ...

You also want an ePaper? Increase the reach of your titles
YUMPU automatically turns print PDFs into web optimized ePapers that Google loves.
Chapter 6 – High Frequency Percussive Ventilator characterization<br />
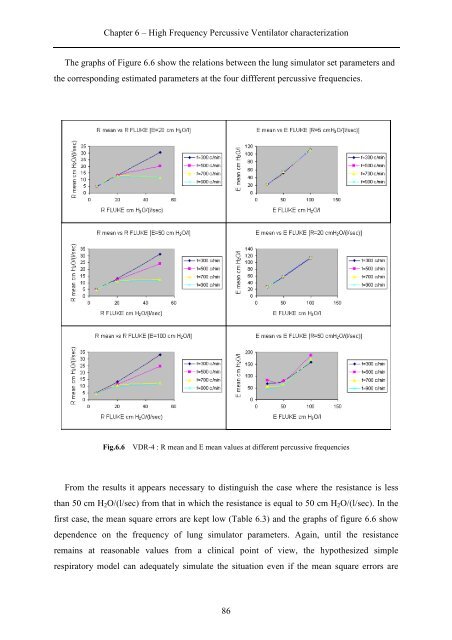
The graphs of Figure 6.6 show the relations between the lung simulator set parameters and<br />
the corresponding estimated parameters at the four diffferent percussive frequencies.<br />
Fig.6.6<br />
VDR-4 : R mean and E mean values at different percussive frequencies<br />
From the results it appears necessary to distinguish the case where the resistance is less<br />
than 50 cm H 2 O/(l/sec) from that in which the resistance is equal to 50 cm H 2 O/(l/sec). In the<br />
first case, the mean square errors are kept low (Table 6.3) and the graphs of figure 6.6 show<br />
dependence on the frequency of lung simulator parameters. Again, until the resistance<br />
remains at reasonable values from a clinical point of view, the hypothesized simple<br />
respiratory model can adequately simulate the situation even if the mean square errors are<br />
86