Comprehensive Plan - Oswego Illinois
Comprehensive Plan - Oswego Illinois
Comprehensive Plan - Oswego Illinois

You also want an ePaper? Increase the reach of your titles
YUMPU automatically turns print PDFs into web optimized ePapers that Google loves.
Densities for <strong>Plan</strong>ning Areas<br />
To plan growth sensitively and smartly, it was<br />
important to incorporate a density study within<br />
the comprehensive planning process. Presently,<br />
<br />
County and surrounding counties are being faced<br />
with issues of suburban sprawl with their municipal<br />
limits moving out to meet outlying subdivision<br />
development. To avoid the negative cost to suburban<br />
sprawl and to preserve natural open land<br />
and features, the density study was developed<br />
to prescribe densities for the planning areas by<br />
clustering development near the Village core and<br />
allowing larger lot development near the outlying<br />
areas near the Village’s edge.<br />
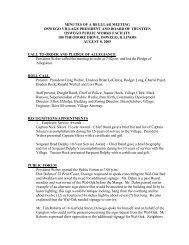
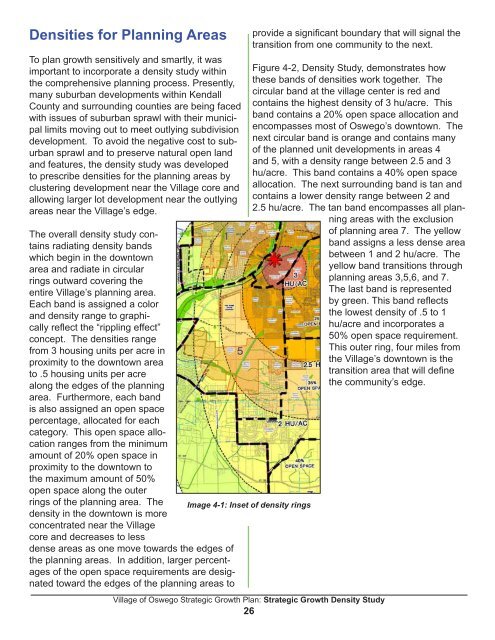
The overall density study contains<br />
radiating density bands<br />
which begin in the downtown<br />
area and radiate in circular<br />
rings outward covering the<br />
entire Village’s planning area.<br />
Each band is assigned a color<br />
and density range to graphi-<br />
<br />
concept. The densities range<br />
from 3 housing units per acre in<br />
proximity to the downtown area<br />
to .5 housing units per acre<br />
along the edges of the planning<br />
area. Furthermore, each band<br />
is also assigned an open space<br />
percentage, allocated for each<br />
category. This open space allocation<br />
ranges from the minimum<br />
amount of 20% open space in<br />
proximity to the downtown to<br />
the maximum amount of 50%<br />
open space along the outer<br />
rings of the planning area. The<br />
density in the downtown is more<br />
concentrated near the Village<br />
core and decreases to less<br />
dense areas as one move towards the edges of<br />
the planning areas. In addition, larger percentages<br />
of the open space requirements are designated<br />
toward the edges of the planning areas to<br />
Image 4-1: Inset of density rings<br />
<br />
transition from one community to the next.<br />
Figure 4-2, Density Study, demonstrates how<br />
these bands of densities work together. The<br />
circular band at the village center is red and<br />
contains the highest density of 3 hu/acre. This<br />
band contains a 20% open space allocation and<br />
encompasses most of <strong>Oswego</strong>’s downtown. The<br />
next circular band is orange and contains many<br />
of the planned unit developments in areas 4<br />
and 5, with a density range between 2.5 and 3<br />
hu/acre. This band contains a 40% open space<br />
allocation. The next surrounding band is tan and<br />
contains a lower density range between 2 and<br />
2.5 hu/acre. The tan band encompasses all planning<br />
areas with the exclusion<br />
of planning area 7. The yellow<br />
band assigns a less dense area<br />
between 1 and 2 hu/acre. The<br />
yellow band transitions through<br />
planning areas 3,5,6, and 7.<br />
The last band is represented<br />
<br />
the lowest density of .5 to 1<br />
hu/acre and incorporates a<br />
50% open space requirement.<br />
This outer ring, four miles from<br />
the Village’s downtown is the<br />
<br />
the community’s edge.<br />
Village of <strong>Oswego</strong> Strategic Growth <strong>Plan</strong>: Strategic Growth Density Study<br />
26