Disability Services Commission - Parliament of Western Australia
Disability Services Commission - Parliament of Western Australia
Disability Services Commission - Parliament of Western Australia

You also want an ePaper? Increase the reach of your titles
YUMPU automatically turns print PDFs into web optimized ePapers that Google loves.
2011-2012<br />
<strong>Disability</strong> <strong>Services</strong> <strong>Commission</strong><br />
Annual Report
About the <strong>Disability</strong> <strong>Services</strong><br />
<strong>Commission</strong><br />
The <strong>Disability</strong> <strong>Services</strong> <strong>Commission</strong> is the State Government agency<br />
responsible for advancing opportunities, community participation and<br />
quality <strong>of</strong> life for people with disability. Established in 1993 under the<br />
<strong>Disability</strong> <strong>Services</strong> Act 1993, the <strong>Commission</strong> provides a range <strong>of</strong> direct<br />
services and supports to people with disability, their families and carers.<br />
As such, the <strong>Commission</strong> is both a funder and a provider <strong>of</strong> disability<br />
support services throughout <strong>Western</strong> <strong>Australia</strong>. The <strong>Commission</strong> works in<br />
partnership with disability sector organisations, state and local government<br />
and other stakeholders to improve participation, inclusion and access for<br />
people with disability, their families and carers.
Responsible Minister:<br />
Accountable Authority:<br />
Board Chairperson:<br />
Director General:<br />
Address:<br />
Minister for <strong>Disability</strong> <strong>Services</strong><br />
The Hon. Helen Morton MLC<br />
<strong>Disability</strong> <strong>Services</strong> <strong>Commission</strong><br />
Mr Bruce Langoulant<br />
Dr Ron Chalmers<br />
Central Administration Building<br />
<strong>Disability</strong> <strong>Services</strong> <strong>Commission</strong><br />
146–160 Colin Street<br />
WEST PERTH 6005<br />
Phone: (08) 9426 9200<br />
TTY: (08) 9426 9315<br />
Fax: (08) 9226 2306<br />
Email:<br />
Website:<br />
dsc@dsc.wa.gov.au<br />
www.disability.wa.gov.au<br />
Country callers: 1800 998 214<br />
ABN 36 922 715 369<br />
This report is available in alternative formats on request.<br />
Underlined text in this document indicates web links for<br />
use with the electronic copy <strong>of</strong> the report.<br />
<strong>Disability</strong> <strong>Services</strong> <strong>Commission</strong> • Annual Report 2011–2012
The Hon. Helen Morton<br />
MLC<br />
Annual Report 2011–2012<br />
In accordance with the Financial Management Act 2006 (Section 61), we hereby submit<br />
for your information and presentation to <strong>Parliament</strong>, the Annual Report <strong>of</strong> the <strong>Disability</strong><br />
<strong>Services</strong> <strong>Commission</strong> for the financial year ending 30 June 2012.<br />
The Annual Report has been prepared in accordance with the provisions <strong>of</strong> the Financial<br />
Management Act 2006.<br />
Bruce Langoulant<br />
Chairperson<br />
<strong>Disability</strong> <strong>Services</strong> <strong>Commission</strong> Board<br />
Shayne Silcox<br />
Deputy Chairperson<br />
<strong>Disability</strong> <strong>Services</strong> <strong>Commission</strong> Board<br />
7 September 2012
Table <strong>of</strong> contents<br />
1.0 Overview 2011–2012......................................................<br />
1.1 Executive summary.........................................................<br />
1.2 Operational structure.......................................................<br />
1.3 Performance Management Framework...........................<br />
2.0 Performance <strong>of</strong> the <strong>Commission</strong>.................................<br />
2.1 Overview <strong>of</strong> operations....................................................<br />
2.2 Service reports ...............................................................<br />
2.3 Quality <strong>of</strong> services...........................................................<br />
2.4 Implementing the Carers Charter....................................<br />
2.5 Pr<strong>of</strong>ile <strong>of</strong> service users....................................................<br />
3.0 Significant issues...........................................................<br />
4.0 Disclosures and legal compliance...............................<br />
4.1 Financial statements .......................................................<br />
4.2 Performance indicators ..................................................<br />
4.3 Other financial disclosures .............................................<br />
4.4 Governance disclosures..................................................<br />
4.5 Other legal requirements.................................................<br />
4.6 Government policy requirements ...................................<br />
Appendix: Funding to disability sector organisations................<br />
2<br />
4<br />
8<br />
21<br />
24<br />
24<br />
28<br />
45<br />
52<br />
54<br />
56<br />
59<br />
60<br />
122<br />
138<br />
144<br />
145<br />
150<br />
157<br />
<strong>Disability</strong> <strong>Services</strong> <strong>Commission</strong> • Annual Report 2011–2012
1.0 Overview 2011–2012<br />
1.1 Executive summary....................................................................................<br />
1.1.1 Chairperson’s report.....................................................................................<br />
1.1.2 Director General’s report..............................................................................<br />
1.2 Operational structure.................................................................................<br />
1.2.1 <strong>Disability</strong> <strong>Services</strong> <strong>Commission</strong> Board.........................................................<br />
1.2.2 Corporate Executive.....................................................................................<br />
1.2.3 Legislative functions.....................................................................................<br />
1.2.4 Compliance with other key legislation .........................................................<br />
1.3 Performance Management Framework...................................................<br />
1.3.1 Links between State Government goals......................................................<br />
1.3.2 <strong>Disability</strong> <strong>Services</strong> <strong>Commission</strong> Strategic Plan 2011–2015.........................<br />
4<br />
6<br />
7<br />
10<br />
12<br />
15<br />
20<br />
20<br />
21<br />
21<br />
22<br />
2
Overview<br />
<strong>Disability</strong> <strong>Services</strong> <strong>Commission</strong> • Annual Report 2011–2012<br />
3
1.1 Executive summary<br />
In 2011–2012 the <strong>Disability</strong> <strong>Services</strong> <strong>Commission</strong>:<br />
• assisted 23,412 <strong>Western</strong> <strong>Australia</strong>ns with disability<br />
• spent $657.47 million to advance the rights and support the needs <strong>of</strong> West<br />
<strong>Australia</strong>ns with disability – a 21.5 per cent increase on last year<br />
• provided 67.5 per cent <strong>of</strong> the <strong>Commission</strong>’s annual budget to 120 disability sector<br />
organisations that provide services and supports directly to the community<br />
• received $533.62 million from the State Government (81 per cent <strong>of</strong> the<br />
<strong>Commission</strong>’s budget)<br />
• received <strong>Australia</strong>n Government funding <strong>of</strong> $110.33 million under the National<br />
<strong>Disability</strong> Agreement and other agreements (17 per cent <strong>of</strong> the <strong>Commission</strong>’s<br />
budget). The remaining two per cent <strong>of</strong> the <strong>Commission</strong>’s revenue was received<br />
from multiple sources.<br />
Many significant achievements have been made, partnerships formed and<br />
initiatives announced during the past year, including:<br />
• Four trial sites for the My Way project were announced - Goldfields, Lower South<br />
West, Cockburn/Kwinana and Perth Hills. My Way aims to increase the level <strong>of</strong><br />
control that individuals and families have over their supports and services. The<br />
outcomes from this project are expected to contribute to the development <strong>of</strong> the<br />
National <strong>Disability</strong> Insurance Scheme.<br />
• More than 100 disability sector organisations benefited from an across-the-board 15<br />
per cent price adjustment on all eligible not-for-pr<strong>of</strong>it community service contracts.<br />
The extra funding was provided in support <strong>of</strong> the State Government’s ‘Delivering<br />
Community <strong>Services</strong> in Partnership Policy’.<br />
• More than $1 million recurrent funding was allocated to respite centres in York and<br />
Gosnells to provide support for people with disability who also have high<br />
medical needs.<br />
• The <strong>Commission</strong>’s Reconciliation Action Plan was reviewed and endorsed for 2012-<br />
2014 and included a commitment to increasing Aboriginal employment rates.<br />
• An Aboriginal employment strategy was developed to explore alternative<br />
employment options as well as to promote and understand Aboriginal culture, and to<br />
build stronger Aboriginal community networks and partnerships.<br />
• The State Government committed $18 million to establish two secure communitybased<br />
accommodation centres for people with an intellectual or cognitive disability<br />
who are accused <strong>of</strong> <strong>of</strong>fences but have been deemed not fit to plead. Legislation will<br />
be required to enable the <strong>Commission</strong> to establish and operate the disability justice<br />
centres. The <strong>Commission</strong> has progressed work on the model <strong>of</strong> service for the<br />
centres and for an in-reach prison program.<br />
4
• As part <strong>of</strong> the Count Me In strategy, the <strong>Commission</strong> appointed another three<br />
ambassadors, produced a widely-disseminated pocket guide and provided grants<br />
to 20 local governments totalling $900,000. The funding is to promote inclusive<br />
and accessible opportunities for people with disability to participate in their<br />
communities.<br />
• During 2011’s <strong>Disability</strong> Awareness Week, more than 650 people attended events<br />
hosted by the <strong>Commission</strong>. These included the Count Me In awards, scholarships<br />
and school competitions. The activities generated more than 100 stories in various<br />
media.<br />
• The <strong>Commission</strong> supported numerous state and local government authorities to<br />
complete the first five-year cycle <strong>of</strong> their <strong>Disability</strong> Access and Inclusion Plan (DAIP).<br />
The <strong>Commission</strong> will assist in the preparation <strong>of</strong> new DAIPs to achieve even higher<br />
levels <strong>of</strong> compliance for next year.<br />
• In November, the Liveable Homes project was launched including design guidelines<br />
aimed at increasing the number <strong>of</strong> private dwellings built using universal design.<br />
A strategy was developed in early 2012 to improve understanding about universal<br />
design among building company owners, sales staff and designers.<br />
• The <strong>Commission</strong> commenced the development <strong>of</strong> a comprehensive sector<br />
development plan. The plan will provide analysis <strong>of</strong> current services and supports<br />
for people with disability across WA according to local government areas. It will<br />
provide a base for identifying current services and demand, and in partnership with<br />
local stakeholders will define opportunities for development.<br />
• The <strong>Commission</strong> allocated $3.3 million to increase the number <strong>of</strong> places available<br />
for its Early Childhood Intervention, School Aged Intervention and Adult Intervention<br />
services to support independence and participation in the community for people<br />
with disability.<br />
• The <strong>Commission</strong> led a collaborative partnership across the disability sector to<br />
implement the Positive Behaviour Strategy. This resulted in the completion <strong>of</strong> the<br />
Effective Service Design project and its expansion into regional <strong>Western</strong> <strong>Australia</strong>.<br />
Executive Summary<br />
<strong>Disability</strong> <strong>Services</strong> <strong>Commission</strong> • Annual Report 2011–2012<br />
5
1.1.1 Chairperson’s report<br />
The disability sector’s vision embodied in the Count Me<br />
In: <strong>Disability</strong> Future Directions strategy has started to<br />
take root in the broader community.<br />
Since its launch by Premier Colin Barnett in December<br />
2009, Count Me In has been widely promoted to state<br />
government departments, local government, disability<br />
sector organisations and community groups. The<br />
strategy has successfully raised awareness <strong>of</strong> the key<br />
issues facing people with disability and to highlight<br />
pathways for change.<br />
This change is being championed by the <strong>Commission</strong>.<br />
In its first year, the Community and Sector Development<br />
Directorate has provided direction and leadership on<br />
Count Me In initiatives and sector development.<br />
As the patron <strong>of</strong> the Count Me In Ambassador program, I was delighted to welcome<br />
three more Count Me In Ambassadors during <strong>Disability</strong> Awareness Week in December<br />
2011. Peter Hall, Imran Ariff and Jim McKiernan joined 21 other ambassadors to raise<br />
awareness about issues that affect people with disability, their families and carers. In<br />
the coming year we will be seeking to appoint more Ambassadors and in particular,<br />
individuals who can give voice to issues affecting people with disability living in rural<br />
and regional areas.<br />
Other key activities this year included:<br />
A Count Me In grants program for local governments to build and strengthen<br />
community partnerships to ensure greater inclusion and participation for people with<br />
disability.<br />
An employment seminar during <strong>Disability</strong> Awareness Week which highlighted issues<br />
facing people with disability in the workplace and the effectiveness <strong>of</strong> partnerships<br />
between disability employment providers and local government authorities. The<br />
<strong>Commission</strong> is in the process <strong>of</strong> developing a comprehensive employment strategy.<br />
The release <strong>of</strong> Quality Service Improvement Grants to help disability sector<br />
organisations move towards self-directed supports and services. Eight applications<br />
were funded and National <strong>Disability</strong> <strong>Services</strong> is coordinating these grants.<br />
A focus on the priority areas for action identified in Count Me In, in particular the<br />
pathways related to housing, health and employment.<br />
It is pleasing to see the messages in Count Me In are being heard and welcomed<br />
across the State. As a result, this strategy for systematic continuous improvement<br />
is being turned into action not only within the <strong>Commission</strong> and the sector, but in<br />
communities across <strong>Western</strong> <strong>Australia</strong>.<br />
6
1.1.2 Director General’s report<br />
There are few aspects <strong>of</strong> our business that will remain<br />
untouched as the nature <strong>of</strong> disability services at a state<br />
and national level continues to grow and change.<br />
The primary challenge the <strong>Commission</strong> faces is to<br />
ensure that the needs and requirements <strong>of</strong> people with<br />
disability, their families and carers remain at the forefront<br />
<strong>of</strong> these reforms and that we achieve better outcomes<br />
for people accessing our services.<br />
There will be a need for the <strong>Commission</strong> to harness<br />
innovation, maintain business continuity and ensure<br />
good governance with appropriate expenditure<br />
throughout the coming year.<br />
State and national reforms will lead to a range <strong>of</strong><br />
initiatives to be harnessed within the <strong>Commission</strong> and the disability sector in <strong>Western</strong><br />
<strong>Australia</strong>.<br />
Already procurement and funding reforms for the community sector have significantly<br />
contributed to improving services and support for more than 100 disability sector<br />
organisations. The focus <strong>of</strong> these organisations is to continuously improve the quality,<br />
flexibility and sustainability <strong>of</strong> services.<br />
We are also strengthening existing partnerships between the <strong>Commission</strong> and<br />
disability sector organisations and establishing new partnership arrangements to build<br />
sector capacity. A sector development plan is being produced to map local resources<br />
and demand for services, to support service consumers and providers.<br />
Executive Summary<br />
Planning and development <strong>of</strong> the My Way project is well underway and the project will<br />
be rolled-out in November. It will be a hands-on practical effort to <strong>of</strong>fer self-directed<br />
supports and services to people with disability and provide them with greater control<br />
over the design and delivery <strong>of</strong> those services. The project reflects the principles <strong>of</strong> the<br />
<strong>Australia</strong>n Productivity <strong>Commission</strong> report into a long-term disability scheme. It will<br />
be a significant opportunity for <strong>Western</strong> <strong>Australia</strong> to contribute to the development <strong>of</strong><br />
a National <strong>Disability</strong> Insurance Scheme (NDIS) with regards to contemporary service<br />
delivery.<br />
I look forward to hearing more about the NDIS during this coming financial year. In<br />
particular, I would like to see greater clarity around funding, governance and eligibility<br />
for the new national scheme.<br />
This past year has seen us take some very deliberate and strong steps forward in<br />
examining the systems and processes that provide supports and services for people<br />
with disability, families and carers throughout <strong>Western</strong> <strong>Australia</strong>.<br />
We have a lot more work ahead <strong>of</strong> us to achieve the outcomes that we all envisage.<br />
I would like to acknowledge the passion and energy <strong>of</strong> <strong>Commission</strong> staff and our<br />
partners within the disability sector who are on this journey with us and are driving the<br />
change that will ultimately lead to better futures for everyone.<br />
<strong>Disability</strong> <strong>Services</strong> <strong>Commission</strong> • Annual Report 2011–2012<br />
7
1.2 Operational structure<br />
The <strong>Disability</strong> <strong>Services</strong> <strong>Commission</strong> was established in December 1993 under the<br />
<strong>Disability</strong> <strong>Services</strong> Act 1993. The Act gives the <strong>Commission</strong> statutory responsibility for<br />
policy and program development and service planning in all areas that affect the rights<br />
and needs <strong>of</strong> West <strong>Australia</strong>ns with disability.<br />
The Hon. Helen Morton MLC has been Minister for <strong>Disability</strong> <strong>Services</strong> since December<br />
2010.<br />
The Ministerial Advisory Council on <strong>Disability</strong> provides independent advice to the<br />
Minister. The 14-member council is chaired by Ms Samantha Jenkinson who was<br />
appointed as the Chairperson in November 2010.<br />
The <strong>Disability</strong> <strong>Services</strong> <strong>Commission</strong> Board is the governing body <strong>of</strong> the <strong>Commission</strong>.<br />
Mr Bruce Langoulant has chaired the Board since July 2007. The Board has nine<br />
members including the Chair <strong>of</strong> the Ministerial Advisory Council on <strong>Disability</strong>.<br />
Dr Ron Chalmers has been Director General <strong>of</strong> the <strong>Disability</strong> <strong>Services</strong> <strong>Commission</strong><br />
since November 2007 and with support from the Corporate Executive, is responsible<br />
for the day-to-day administration <strong>of</strong> the <strong>Commission</strong>.<br />
The <strong>Commission</strong> holds regular state-wide Reference Networks where people with<br />
disability, their families and carers as well as sector organisations can raise concerns<br />
and views directly with Board members for appropriate follow-up by Corporate<br />
Executive. During 2011–2012, 11 meetings were held.<br />
To ensure a clear separation between its functions as a funder, provider and<br />
coordinator <strong>of</strong> disability services, the <strong>Commission</strong> has seven directorates that have<br />
responsibility for particular areas <strong>of</strong> operation.<br />
Accommodation <strong>Services</strong> provides people with an intellectual disability who receive<br />
its services with a home and necessary supports to enable that person to have a<br />
‘good life’. These services are based on individual needs and aim to maximise<br />
outcomes for each person.<br />
Community and Sector Development promotes and influences the ongoing<br />
development <strong>of</strong> the disability services sector consistent with State Government<br />
policy. The Directorate implements its Count Me In: <strong>Disability</strong> Future Directions 15<br />
year plan and the <strong>Commission</strong>’s Strategic Plan for 2011–2015.<br />
Corporate <strong>Services</strong> provides financial services, human resources and workforce<br />
planning services, information, communication and technology services, procurement<br />
and asset management services.<br />
Local Area Coordination manages the state-wide Local Area Coordination (LAC)<br />
program which works at individual, family, community and government levels,<br />
assisting people with disability to live in their communities. assisting people with<br />
disability to live in their communities.<br />
8
Policy and Strategy provides strategic policy, program, funding and planning advice<br />
to government and the sector. It promotes and coordinates the <strong>Commission</strong>’s<br />
information and<br />
community education strategies, manages its external non-financial performance<br />
reporting requirements and coordinates the evaluation <strong>of</strong> <strong>Commission</strong> programs and<br />
policies.<br />
Service Contracting and Development supports people with disability by<br />
distributing, through fair and transparent procedures, available funds to disability<br />
sector organisations. It also purchases quality disability-related services for people<br />
with disability, their families and carers.<br />
Statewide Specialist <strong>Services</strong> provides therapy, psychology and social work<br />
support and consultancy to people with disability, their families, carers, agencies and<br />
the community.<br />
Operational Structure<br />
<strong>Disability</strong> <strong>Services</strong> <strong>Commission</strong> • Annual Report 2011–2012<br />
9
Minister for <strong>Disability</strong> <strong>Services</strong><br />
The Hon. Helen Morton MLC<br />
Ministerial Advisory Council on <strong>Disability</strong><br />
Chairperson<br />
Ms Samantha Jenkinson (14 members)<br />
Office <strong>of</strong> the Director General<br />
Ms Mary McHugh<br />
<strong>Disability</strong> <strong>Services</strong> <strong>Commission</strong><br />
Director General<br />
Dr Ron Chalmers<br />
Corporate Executive<br />
Director National <strong>Disability</strong><br />
Insurance Scheme<br />
Ms Marion Hailes-MacDonald<br />
Executive Director<br />
Statewide Specialist <strong>Services</strong><br />
Ms Susan Peden<br />
Executive Director<br />
Corporate <strong>Services</strong><br />
Mr Sam Ciminata<br />
Executive Director<br />
Policy and Strategy<br />
Ms Wendy Murray<br />
Executive Director<br />
Local Area Coordination My Way<br />
Project<br />
Ms Robyn Massey<br />
Executive Director<br />
Accommodation <strong>Services</strong><br />
Ms Wendy Cox<br />
10
<strong>Disability</strong> <strong>Services</strong> <strong>Commission</strong> Board<br />
Chairperson<br />
Mr Bruce Langoulant<br />
Reference Networks<br />
(People with disability, their families and<br />
carers, and service providers)<br />
Rural and regional<br />
A/Executive Director<br />
Local Area Coordination<br />
Mr Chris Yates<br />
Metropolitan<br />
Operational Structure<br />
Executive Director<br />
Community and Sector<br />
Development<br />
Ms Monique Williamson<br />
Executive Director<br />
Service Contracting and<br />
Development<br />
Mr Peter Batini<br />
<strong>Disability</strong> <strong>Services</strong> <strong>Commission</strong> • Annual Report 2011–2012<br />
11
1.2.1 <strong>Disability</strong> <strong>Services</strong> <strong>Commission</strong> Board<br />
The <strong>Disability</strong> <strong>Services</strong> <strong>Commission</strong> is governed by a nine-member board and, as<br />
specified under the <strong>Disability</strong> Service Act 1993, at least five <strong>of</strong> them either have a<br />
disability, have a relative with a disability, or have recent experience as a carer or an<br />
advocate for people with disability.<br />
Mr Bruce Langoulant (Chairperson) has worked in<br />
small business for 40 years with particular emphasis<br />
on the advertising and financial services industries.<br />
Bruce has a daughter with multiple disabilities and is<br />
Chairperson <strong>of</strong> The Meningitis Centre and President<br />
<strong>of</strong> the International Confederation <strong>of</strong> Meningitis<br />
Organisations. Term expires June 2013.<br />
Dr Shayne Silcox (Deputy Chairperson) is the Chief<br />
Executive Officer <strong>of</strong> the City <strong>of</strong> Melville. Starting<br />
his career as a heavy-duty motor mechanic, he has<br />
achieved a PhD in Management and Marketing, a<br />
Masters <strong>of</strong> Commerce, a Post Graduate Diploma<br />
<strong>of</strong> Management and a Bachelor <strong>of</strong> Business, plus<br />
other supporting diplomas and certificates. Shayne<br />
is committed to the concept <strong>of</strong> inclusion for people<br />
with disability and pursues service improvements for them within local government<br />
authorities. Term expires November 2012.<br />
Dr Tony Curry is the Principal <strong>of</strong> Mercy College,<br />
a Catholic co-educational Kindergarten to Year 12<br />
school. Tony is father to four children, one <strong>of</strong> whom<br />
has a moderate intellectual disability. Dr Curry has<br />
extensive experience in working with students with<br />
disability and their families and carers to develop<br />
optimal opportunities. He is a strong advocate for<br />
students with disability having access to education on<br />
the same basis as those students without disability. Term expires December 2013.<br />
12
Ms Wendy Dimer has experience in the delivery <strong>of</strong><br />
services to people with a disability outside the Perth<br />
metropolitan area. She has worked closely with<br />
<strong>Disability</strong> <strong>Services</strong> <strong>Commission</strong> staff in Kalgoorlie to<br />
improve service delivery to Aboriginal people with<br />
disability. Wendy also has experience as a carer <strong>of</strong><br />
a person with disability. Term expired in May 2012.<br />
Mr Mike Tidy is the Director <strong>of</strong> Corporate <strong>Services</strong><br />
at the City <strong>of</strong> Joondalup. He is the father <strong>of</strong> three<br />
children, one <strong>of</strong> whom has spina bifida. Mike has<br />
coached his children’s T-ball team (to northwest<br />
championship level) and baseball as well as assisting<br />
in various roles at football and swimming. He has<br />
been treasurer <strong>of</strong> his children's school’s Parent<br />
Association and is a long-term supporter <strong>of</strong> the Spina<br />
Bifida Association. Mike strongly supports inclusion for people with disability in all<br />
aspects <strong>of</strong> the community. Term expires December 2013.<br />
Operational Structure<br />
Ms Kathy Hough is the Executive Officer <strong>of</strong> the<br />
Community Living Association Inc, a not-for-pr<strong>of</strong>it<br />
organisation that provides support for people with<br />
disability and their families. Kathy and her family have<br />
cared for a person with a severe intellectual disability<br />
for more than 13 years. She was an inaugural member<br />
<strong>of</strong> the Chief Executive Officer Round Table established<br />
in 2008. Kathy is a strong advocate for small regional<br />
disability service organisations at whole-<strong>of</strong>-sector forums. Term expires May 2014.<br />
<strong>Disability</strong> <strong>Services</strong> <strong>Commission</strong> • Annual Report 2011–2012<br />
13
1.2.1 <strong>Disability</strong> <strong>Services</strong> <strong>Commission</strong> Board continued<br />
Mr Philip Thick has extensive corporate and<br />
commercial knowledge, direct experience <strong>of</strong><br />
managing large workforces, and board and director<br />
experience across a wide range <strong>of</strong> small to large<br />
businesses. Philip was CEO and Director <strong>of</strong> Coogee<br />
Chemicals for the past four years and is now<br />
Managing Director and CEO <strong>of</strong> MHM Metals Limited,<br />
as well as Non-Executive Chairman or Director <strong>of</strong><br />
several other public listed companies. He is Chairperson <strong>of</strong> Perth Home Care <strong>Services</strong>,<br />
a large not-for-pr<strong>of</strong>it community sector organisation. Term expires November 2014.<br />
Ms Laura Miller has a Master <strong>of</strong> Human Rights<br />
Practice and Bachelor <strong>of</strong> Social Work. She is currently<br />
studying for a PhD in <strong>Disability</strong> Human Rights at<br />
Curtin University. Laura works as a Supervising Case<br />
Manager in the Human Rights Division at the State<br />
Administrative Tribunal. She has experience dealing<br />
with a range <strong>of</strong> disability human rights issues and has<br />
personal experience <strong>of</strong> disability. In 2010 Laura was<br />
awarded the Young <strong>Disability</strong> Challenge Award. Term expires November 2014.<br />
Ms Samantha Jenkinson has a Bachelor <strong>of</strong> Social<br />
Work and works in project management in the<br />
disability sector. She has personal experience <strong>of</strong><br />
disability and has extensive experience in advocacy<br />
and policy development in the disability sector.<br />
Samantha is Chairperson <strong>of</strong> the Ministerial Advisory<br />
Council on <strong>Disability</strong>, a former Chairperson and now<br />
a member <strong>of</strong> the <strong>Australia</strong>n Federation <strong>of</strong> <strong>Disability</strong> Organisations. Samantha is also a<br />
member <strong>of</strong> the management committee <strong>of</strong> Women with Disabilities <strong>Australia</strong> and has<br />
strong links with People With Disabilities (WA) Inc and National <strong>Disability</strong> <strong>Services</strong>.<br />
Term expires November 2013.<br />
14
1.2.2 Corporate Executive<br />
The day-to-day administration <strong>of</strong> the <strong>Commission</strong> is the responsibility <strong>of</strong> the Director<br />
General supported by the Corporate Executive.<br />
Director General<br />
Dr Ron Chalmers has a background in teaching and<br />
educational administration. He became involved in<br />
disability services in 1991 as Local Area Coordinator<br />
Supervisor for the Upper Great Southern region.<br />
Ron has extensive experience in the development<br />
and expansion <strong>of</strong> local area coordination and in the<br />
needs <strong>of</strong> people living in rural communities. He holds a PhD that enquired into the<br />
inclusion <strong>of</strong> children with severe and pr<strong>of</strong>ound disabilities into mainstream schooling.<br />
He was a participant in the inaugural <strong>Australia</strong> and New Zealand School <strong>of</strong> Government<br />
Executive Fellows Program.<br />
Executive Director,<br />
Accommodation <strong>Services</strong><br />
Ms Wendy Cox has been involved in service provision<br />
for people with a disability since 1990. Wendy was<br />
a Senior Manager <strong>of</strong> Accommodation, Recreation,<br />
Alternatives to Employment, Library and Family<br />
<strong>Services</strong> with Activ Foundation before joining the<br />
<strong>Commission</strong> in 2003. She has a Bachelor <strong>of</strong> Arts in Psychology.<br />
Operational Structure<br />
Executive Director,<br />
Community and Sector Development<br />
Ms Monique Williamson has broad experience in<br />
disability policy, research and service provision. She<br />
has an enthusiasm for social policy and its impact<br />
on the West <strong>Australia</strong>n community. Monique has<br />
worked in disability services for more than 20 years in<br />
accommodation support, training and development and a number <strong>of</strong> years with a peak<br />
industry body. Monique has a Bachelor <strong>of</strong> Arts in Training and Development and is<br />
completing a Masters in Social Science, Social Change and Development.<br />
<strong>Disability</strong> <strong>Services</strong> <strong>Commission</strong> • Annual Report 2011–2012<br />
15
1.2.2 Corporate Executive continued<br />
Executive Director, Corporate <strong>Services</strong><br />
Mr Sam Ciminata has a strong background in<br />
economic and financial management.<br />
He started his career in the economic policy area <strong>of</strong><br />
the Treasury Department before moving to a private<br />
sector consulting role. Sam later rejoined the public<br />
sector to head Strategic Asset Management at the<br />
Department <strong>of</strong> Transport. Sam joined the <strong>Commission</strong> in 2000 and has held various<br />
senior roles in service management and reform programs across finance, asset<br />
management, information technology and human resources. He has a Bachelor <strong>of</strong><br />
Business in Finance and Economics.<br />
Executive Director, Local Area Coordination<br />
Ms Robyn Massey joined the <strong>Commission</strong> in 1994 as<br />
Local Area Coordination Manager in the Lower Great<br />
Southern before moving to Perth in 2000 to take up a<br />
position as a Country Manager. A former teacher and<br />
administrator with the Department <strong>of</strong> Education, Robyn<br />
spent 20 years living and working in regional and remote<br />
areas <strong>of</strong> WA and has a real understanding <strong>of</strong> issues facing country people. She has a<br />
Bachelor <strong>of</strong> Arts and a Diploma <strong>of</strong> Education. Robyn is now Executive Director <strong>of</strong> the My<br />
Way project.<br />
Executive Director, Local Area Coordination<br />
(Acting from January 2012)<br />
Mr Chris Yates joined the <strong>Commission</strong> in 1996 as a<br />
Local Area Coordination manager in the Upper Great<br />
Southern based in Narrogin. Chris has held a variety <strong>of</strong><br />
roles within the Directorate including Country Manager<br />
and Director. Chris has worked in education across the<br />
state, spending most <strong>of</strong> his time in country areas. Chris holds a Bachelor <strong>of</strong> Arts, Diploma<br />
<strong>of</strong> Education and a Master <strong>of</strong> Educational Management (with Honours).<br />
16
Executive Director, Policy and Strategy<br />
(Acting until October 2011)<br />
Ms Marion Hailes-MacDonald has a Bachelor<br />
<strong>of</strong> Science (Nursing), Master <strong>of</strong> Commerce<br />
(Management) and was awarded a State Government<br />
scholarship in 2008 to undertake an Executive Master<br />
<strong>of</strong> Public Administration. Marion worked in acute<br />
and community health before joining the <strong>Commission</strong> more than 20 years ago. Marion<br />
has managed high support accommodation services, introduced innovative programs<br />
across the state and has worked closely with community sector organisations to<br />
develop family support and respite services. She has contributed to, and led significant<br />
funding and policy directions on both state and national agendas.<br />
Executive Director, Policy and Strategy<br />
(from October 2011)<br />
Ms Wendy Murray has 12 years’ experience<br />
in executive and leadership roles within state<br />
government with a strong record in complex<br />
legislative and policy environments. Wendy has a<br />
long-standing commitment to equal opportunity<br />
for people with disability, supporting access and inclusion. Wendy has held senior<br />
positions at the Department <strong>of</strong> Local Government and the Office <strong>of</strong> Crime Prevention.<br />
Awarded a Churchill Fellowship in 2004, Wendy also has a Bachelor <strong>of</strong> Arts, Post<br />
Graduate Diploma <strong>of</strong> Education and Post Graduate units in Policy. Wendy has<br />
completed the Harvard Business School – Senior Executive Forum II: Leadership,<br />
Strategy and Technology and the Public Sector Management Office Executive<br />
Development Program.<br />
Operational Structure<br />
<strong>Disability</strong> <strong>Services</strong> <strong>Commission</strong> • Annual Report 2011–2012<br />
17
1.2.2 Corporate Executive continued<br />
Executive Director, Service Contracting<br />
and Development<br />
Mr Peter Batini has worked at the <strong>Commission</strong> for<br />
27 years. Peter has served as Regional Director <strong>of</strong> the<br />
<strong>Commission</strong>’s South West and North Metropolitan<br />
regions and has been Chief Clinical Psychologist.<br />
Since 2000, he has contributed to the <strong>Commission</strong>’s<br />
work on contract planning, contract formation, contract management, quality<br />
assurance and the development <strong>of</strong> human services. A Master in Psychology, Peter<br />
also has completed the Public Sector Management Office Executive Development<br />
Year (1990), is a graduate <strong>of</strong> the <strong>Australia</strong>n Institute <strong>of</strong> Company Directors and in 1994,<br />
completed a Churchill Fellowship in de-institutionalisation and<br />
community-based housing.<br />
Executive Director, Statewide Specialist<br />
<strong>Services</strong><br />
Ms Susan Peden has extensive experience in the<br />
disability sectors in <strong>Western</strong> <strong>Australia</strong> and Britain.<br />
Susan holds a Bachelor <strong>of</strong> Arts and is a licentiate <strong>of</strong><br />
the College <strong>of</strong> Speech Therapy. Susan has been the<br />
<strong>Commission</strong>’s Principal Speech Pathologist, a Local<br />
Area Coordinator and Manager <strong>of</strong> <strong>Disability</strong> Pr<strong>of</strong>essional <strong>Services</strong> where she developed<br />
evidence-based services that are both person and family centred. Sue is editor <strong>of</strong> the<br />
magazine, ‘Intellectual <strong>Disability</strong>, Australasia’, a former President <strong>of</strong> the Australasian<br />
Society for Intellectual <strong>Disability</strong> and currently, Chairperson for the Consultative<br />
Committee for Edith Cowan University’s Department <strong>of</strong> Occupational Therapy.<br />
18
Operational Structure<br />
<strong>Disability</strong> <strong>Services</strong> <strong>Commission</strong> • Annual Report 2011–2012<br />
19
1.2.3 Legislative functions<br />
The key functions <strong>of</strong> the <strong>Commission</strong> are specified in Section 12 <strong>of</strong> the <strong>Disability</strong><br />
<strong>Services</strong> Act 1993. These are:<br />
• policy development—including advice, research and evaluation<br />
• service provision—both directly and by encouraging the development <strong>of</strong><br />
appropriate services by other agencies<br />
• funding and accountability—enabling non-government agencies to provide a<br />
diverse range <strong>of</strong> services that <strong>of</strong>fer choices for people with disability, their families<br />
and carers<br />
• promotion <strong>of</strong> equal access—enabling access to services provided by government<br />
and those generally available in the community<br />
• community education and consumer advocacy—promoting and protecting the<br />
dignity and rights <strong>of</strong> people with disability<br />
1.2.4 Compliance with other key legislation<br />
The <strong>Commission</strong> administers the <strong>Disability</strong> <strong>Services</strong> Act 1993 and in the conduct <strong>of</strong><br />
its business, is subject to a wide range <strong>of</strong> both State and <strong>Australia</strong>n Government<br />
statutes.<br />
The <strong>Commission</strong> is listed as a government department for the purpose <strong>of</strong> meeting the<br />
requirements <strong>of</strong> the Public Sector Management Act 1994, Superannuation and<br />
Family Benefits Act 1938, Government Employees Superannuation Act 1987 and the<br />
Government Employees Housing Act 1964.<br />
In the performance <strong>of</strong> its functions, the <strong>Commission</strong> complies with relevant written<br />
law and in particular the:<br />
• Auditor Generals Act 2006<br />
• Carers Recognition Act 2004<br />
• Contaminated Sites Act 2003<br />
• <strong>Disability</strong> Discrimination Act 1992<br />
• Equal Opportunity Act 1984<br />
• Financial Management Act 2006<br />
• Freedom <strong>of</strong> Information Act 1992<br />
• Occupational Health, Safety and Welfare Act 1984<br />
• Public Interest Disclosure Act 2003<br />
• Public Sector Management Act 1994<br />
• State Records Act 2000<br />
• State Supply <strong>Commission</strong> Act 1991<br />
• Workers’ Compensation and Rehabilitation Act 1981<br />
20
1.3 Performance Management<br />
Framework<br />
1.3.1 Links between State Government goals<br />
There are five government goals that guide the development <strong>of</strong> policies,<br />
programs and services within <strong>Western</strong> <strong>Australia</strong>n government agencies. Given<br />
the variety and diversity <strong>of</strong> public agencies in WA, not all government goals<br />
are equally applicable to all agencies. The government goal ‘Outcomes-Based<br />
Service Delivery’ best covers the <strong>Commission</strong>’s core work.<br />
The links between the government goals and the work <strong>of</strong> the <strong>Commission</strong> for<br />
2011–2012 are outlined in the following table:<br />
State Government Goals<br />
<strong>Disability</strong> <strong>Services</strong> <strong>Commission</strong><br />
Strategic Plan 2011–2015<br />
Outcomes-Based Service Delivery<br />
Greater focus on achieving results<br />
in key service delivery areas for the<br />
benefit <strong>of</strong> all West <strong>Australia</strong>ns.<br />
Vision<br />
All people live in welcoming<br />
communities that facilitate citizenship,<br />
friendship, mutual support and a fair go<br />
for everyone.<br />
There are five strategic directions:<br />
1. people with disability, their families<br />
and carers are at the centre <strong>of</strong><br />
decision-making about disability<br />
issues and services<br />
2. the disability services sector fosters<br />
the best blends <strong>of</strong> supports and<br />
services<br />
3. communities are welcoming <strong>of</strong><br />
people with disability, their families<br />
and carers<br />
4. there is increased availability and<br />
choice <strong>of</strong> personalised supports and<br />
services<br />
5. there are integrated responses to<br />
disability issues at national, state<br />
and local levels.<br />
Performance Management Framework<br />
<strong>Disability</strong> <strong>Services</strong> <strong>Commission</strong> • Annual Report 2011–2012<br />
21
<strong>Disability</strong> <strong>Services</strong> <strong>Commission</strong><br />
Annual Service and Obligatory<br />
Reports<br />
Service Reports:<br />
• Accommodation Support (Chapter<br />
2.2.1)<br />
• Individual and Family Support<br />
(Chapter 2.2.2)<br />
• Individual Coordination (Chapter<br />
2.2.3)<br />
• Strategic Coordination (Chapter<br />
2.2.4)<br />
• Community Access and Inclusion<br />
(Chapter 2.2.5)<br />
• <strong>Disability</strong> Access and Inclusion Plan<br />
Outcomes (Chapter 4.5.3)<br />
• Substantive Equality (Chapter 4.6.2)<br />
1.3.2 <strong>Disability</strong> <strong>Services</strong> <strong>Commission</strong> Strategic Plan<br />
2011-2015<br />
The <strong>Disability</strong> <strong>Services</strong> <strong>Commission</strong>’s fourth strategic plan sets the directions for<br />
disability services in <strong>Western</strong> <strong>Australia</strong> from 2011–2015. The plan integrates key<br />
priorities from Count Me In: <strong>Disability</strong> Future Directions, State Government strategic<br />
directions, the National <strong>Disability</strong> Agreement, the National <strong>Disability</strong> Strategy and the<br />
United Nations Convention on the Rights <strong>of</strong> Persons with Disabilities.<br />
The five strategic directions emphasise:<br />
• people with disability, their families and carers are at the centre <strong>of</strong> decision-making<br />
about disability issues and services<br />
• the disability services sector fosters the best blend <strong>of</strong> supports and services.<br />
• communities are welcoming <strong>of</strong> people with disability, their families and carers<br />
• there is increased availability and choice <strong>of</strong> personalised supports and services<br />
• there are integrated responses to disability issues at national, state and local levels<br />
The strategic directions will be implemented by each <strong>Commission</strong> directorates through<br />
the development <strong>of</strong> operational plans that guide and review progress made on key<br />
specific initiatives.<br />
22
Vision<br />
The <strong>Commission</strong> will achieve its vision by:<br />
• ensuring the strong and central involvement <strong>of</strong> people with disability, their<br />
families and carers in advising and leading strategic developments<br />
• providing strong leadership to champion the rights <strong>of</strong> people with disability,<br />
their families and carers and by working for them to receive the supports<br />
and services they need<br />
• actively engaging communities, disability sector organisations, the private<br />
sector and all levels <strong>of</strong> government<br />
• delivering supports and services that are accessible, <strong>of</strong> high quality and<br />
culturally appropriate<br />
• ensuring our directions are guided by contemporary thinking and evidencebased<br />
practice<br />
• being accountable for our performance and building a sustainable<br />
organisation.<br />
Values<br />
Values which guide the work <strong>of</strong> the <strong>Commission</strong>:<br />
Commitment—we are committed to our vision for people with disability and<br />
their families<br />
Respect—we value cultural diversity and encourage everyone’s unique<br />
contribution<br />
Integrity—we are honest and truthful about our decisions and actions<br />
Working together—we work together cooperatively to get things done and<br />
pursue our vision<br />
Openness—our decision-making and communications are clear and<br />
transparent<br />
Leadership—our actions reflect our leadership responsibilities<br />
Accountability—we are openly accountable for our decisions and actions<br />
Continued learning—we are committed to a culture <strong>of</strong> excellence and<br />
continued learning.<br />
Performance Management Framework<br />
<strong>Disability</strong> <strong>Services</strong> <strong>Commission</strong> • Annual Report 2011–2012<br />
23
2.0 Performance <strong>of</strong> the<br />
<strong>Commission</strong><br />
2.1 Overview <strong>of</strong> operations.............................................................................<br />
2.1.1 Funding sources..........................................................................................<br />
2.1.2 <strong>Commission</strong> funding to disability sector organisations...............................<br />
2.2 Service reports ..........................................................................................<br />
2.2.1 Accommodation support ............................................................................<br />
2.2.2 Individual support .......................................................................................<br />
2.2.3 Total individual coordination .......................................................................<br />
2.2.4 Family and carers support...........................................................................<br />
2.2.5 Community access and inclusion................................................................<br />
2.3 Quality <strong>of</strong> services ....................................................................................<br />
2.3.1 Quality Management Framework ...............................................................<br />
2.3.2 Complaints handling....................................................................................<br />
2.3.3 Consumer satisfaction survey.....................................................................<br />
2.4 Implementing the Carers Charter............................................................<br />
2.5 Pr<strong>of</strong>ile <strong>of</strong> service users.............................................................................<br />
2.5.1 Annual client and service data collection ...................................................<br />
24<br />
26<br />
26<br />
28<br />
28<br />
31<br />
35<br />
38<br />
41<br />
45<br />
45<br />
46<br />
50<br />
52<br />
54<br />
55<br />
2.1 Overview <strong>of</strong> operations<br />
The <strong>Commission</strong> has an integrated approach to planning and performance that<br />
provides links between legislation, policy, the <strong>Commission</strong>’s Strategic Plan, State<br />
Government priorities and the <strong>Commission</strong>’s operational plans.<br />
The <strong>Commission</strong> is allocated funding to provide services in five key areas to enhance<br />
the environment and wellbeing <strong>of</strong> people with disability and their carers by the<br />
provision <strong>of</strong> necessary supports and services. The <strong>Commission</strong>’s performance<br />
and achievements for each service area are reported in Chapter 2.2 <strong>of</strong> this report.<br />
Performance measures for auditing purposes are reported in Chapter 4.2.<br />
24
In brief...<br />
In 2011-2012, 23,412 West <strong>Australia</strong>ns accessed a<br />
disability support service, an increase <strong>of</strong> 5.1 per cent from<br />
last year.<br />
The <strong>Commission</strong>’s total expenditure was $657.47 million,<br />
an increase <strong>of</strong> 21.5 per cent from last year and averaged<br />
$28,083 per person in receipt <strong>of</strong> funded services.<br />
The <strong>Commission</strong>’s funding to disability sector<br />
organisations was $444 million, an increase <strong>of</strong> 27.5 per<br />
cent from last year.<br />
Three years at a glance<br />
Measure 2009–10 2010–11 2011–12<br />
<strong>Disability</strong> support services<br />
Total number <strong>of</strong><br />
service users<br />
Average cost per<br />
service user<br />
Funding ($ millions)<br />
Total <strong>Disability</strong><br />
<strong>Services</strong><br />
<strong>Commission</strong><br />
expenditure<br />
Change<br />
from last<br />
year<br />
21,652 22,207 23,412 5.1%<br />
$22,465 $24,368 $28,083 15.2%<br />
$486.42 $541.15 $657.47 $116.32<br />
Overview <strong>of</strong> operations<br />
Commonwealth<br />
funding<br />
$77.62 $94.41 $110.33 $15.92<br />
State funding $391.90 $434.38 $533.62 $99.24<br />
Funding from<br />
other sources<br />
$11.76 $12.43 $13.89 $1.46<br />
<strong>Disability</strong> <strong>Services</strong> <strong>Commission</strong> • Annual Report 2011–2012<br />
25
2.1.1 Funding sources<br />
State funding<br />
State funding for operations in 2011–2012 was $533.62 million. Over the past five<br />
years, the State Government’s funding <strong>of</strong> disability services has increased by an<br />
average <strong>of</strong> 14 per cent per year.<br />
Commonwealth Government funding<br />
The Commonwealth Government provided $110.33 million under the National <strong>Disability</strong><br />
Agreement. Over the past five years, Commonwealth funding has also increased by an<br />
average <strong>of</strong> 18 per cent per year.<br />
2.1.2 <strong>Commission</strong> funding to disability sector<br />
organisations<br />
The <strong>Commission</strong> allocates funding to disability sector organisations to provide<br />
accommodation support, individual support, individual coordination, family and carers<br />
support and community access and inclusion. (Refer to Appendix for details <strong>of</strong> funding to<br />
disability sector organisations).<br />
In 2011-2012, the <strong>Commission</strong> funded 120 disability sector organisations. The<br />
<strong>Commission</strong> uses standard contract management practices to closely monitor the financial<br />
sustainability <strong>of</strong> all funded service providers.<br />
<strong>Disability</strong> sector<br />
organisation funding<br />
Funded<br />
$5 million<br />
Number <strong>of</strong><br />
organisations<br />
in 2010–2011<br />
Number <strong>of</strong><br />
organisations<br />
in<br />
2011–2012<br />
7 6<br />
55 53<br />
34 38<br />
20 23<br />
Total 116 120<br />
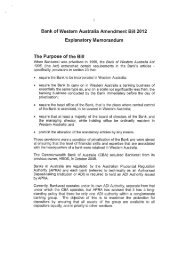
Over the past five years, funding to disability sector organisations has more than<br />
doubled with an annual growth rate <strong>of</strong> 22 per cent per year, from $213 million in<br />
2007–2008 to $444 million in 2011–2012. In comparison, the <strong>Commission</strong>’s operational<br />
cost increased by an annual rate <strong>of</strong> eight per cent per year from $153 million in<br />
2007–2008 to $213.5 million in 2011–2012. This reflects the strong commitment by the<br />
<strong>Commission</strong> to support service growth in community-based services.<br />
26
Figure 1: Total cost <strong>of</strong> services 2007–2008 to 2011–2012<br />
Funding ($ millions)<br />
500.0<br />
450.0<br />
400.0<br />
350.0<br />
300.0<br />
250.0<br />
200.0<br />
150.0<br />
100.0<br />
50.0<br />
0.0<br />
<strong>Commission</strong> operational<br />
budget<br />
<strong>Disability</strong> sector<br />
organisations<br />
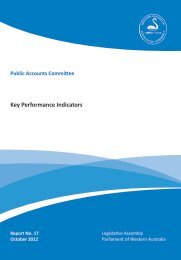
The number <strong>of</strong> people who received services provided only by the <strong>Commission</strong> was<br />
4,770. The number <strong>of</strong> people who received individually funded services from<br />
disability sector organisations was 6,384 and the number <strong>of</strong> people who received<br />
services from both the <strong>Commission</strong> and disability sector organisations was 5,692.<br />
There is large variability in the resources required for services, from high-cost 24-<br />
hour care and accommodation to hourly sessions <strong>of</strong> therapy services.<br />
Figure 2: Service distribution<br />
2007-08 2008-09 2009-10 2010-11 2011-12<br />
153.0 176.3 183.5 193.0 213.5<br />
213.0 257.7 302.9 348.2 444.0<br />
Overview <strong>of</strong> operations<br />
<strong>Commission</strong><br />
services only:<br />
4,770<br />
Both<br />
<strong>Commission</strong><br />
and disability<br />
sector<br />
organisation<br />
services:<br />
5,692<br />
disability<br />
sector<br />
organisation<br />
services<br />
only: 6,384<br />
Diagram notes:<br />
a) This diagram represents a simple picture <strong>of</strong> the services delivered because no<br />
distinction has been made between service intensity.<br />
b) The remaining 6,566 service users received Community Aids and Equipment<br />
and are not included in the total count <strong>of</strong> service users presented here.<br />
<strong>Disability</strong> <strong>Services</strong> <strong>Commission</strong> • Annual Report 2011–2012<br />
27
2.2 Service reports<br />
There are five key service areas aimed at enhancing the environment and wellbeing<br />
<strong>of</strong> people with disability and their carers by providing necessary supports and<br />
services. The five service areas are accommodation support, individual support,<br />
individual coordination, family and carers support and community access and<br />
inclusion.<br />
2.2.1 Service 1—Accommodation support<br />
Accommodation support services are provided by service providers in the sector and<br />
by the <strong>Commission</strong>’s Accommodation <strong>Services</strong> Directorate. Around 60 per cent <strong>of</strong> the<br />
budget for accommodation support is provided to disability sector organisations.<br />
Key strategies:<br />
Accommodation services support people with disability to live in a range <strong>of</strong> different<br />
ways including hostels, group homes or supported community living in their own<br />
homes. This includes support with personal care and development <strong>of</strong> independent<br />
living skills and might range from a few hours <strong>of</strong> support a week to 24-hour care.<br />
In brief...<br />
3,340 people accessed accommodation, an increase <strong>of</strong> 6.9<br />
per cent.<br />
The total cost for Accommodation <strong>Services</strong> for 2011–2012<br />
was $391.299 million, averaging $117,155 per person.<br />
28
Three years at a glance<br />
Measure 2009–10 2010–11 2011–12<br />
Total accommodation<br />
service users<br />
3,036 3,123 3,340<br />
Hostel 365 336 312<br />
Community residential 1,451 1,525 1,579<br />
Supported community<br />
living<br />
Average cost per service<br />
user<br />
1,353 1,366 1,563<br />
$97,323 $104,914 $117,155<br />
Total cost ($ millions) $251.0 $327.6 $391.3<br />
Consumer satisfaction 85% 82% 84%<br />
Service reports<br />
Table Notes:<br />
(a) All figures have been re-calculated since the 2009–2010 annual report as a<br />
result <strong>of</strong> a transition to a new annual reporting framework.<br />
(b) The subtotals do not add up to the total because some people received<br />
multiple services.<br />
Combined Applications Process<br />
In 2011–2012, 595 people applied for accommodation support funding and <strong>of</strong> these,<br />
210 people had re-applied for additional support funding as a result <strong>of</strong> their changing<br />
needs. Funding was provided to 207 people (35 per cent) and a further four people<br />
took up vacancies. Under the new Community Living Initiative, 66 people were<br />
supported, 50 people received additional supports as a result <strong>of</strong> changing needs and<br />
177 people had their new accommodation option finalised in 2011–2012.<br />
<strong>Disability</strong> <strong>Services</strong> <strong>Commission</strong> • Annual Report 2011–2012<br />
29
Young people in residential aged care<br />
The Young People in Residential Aged Care (YPIRAC) program was a five-year<br />
program jointly funded by the State and <strong>Australia</strong>n Governments. The program’s<br />
overall objective was to reduce the number <strong>of</strong> younger people in residential aged<br />
care using the following three strategies:<br />
• moving people into appropriate supported disability accommodation<br />
• diverting people at risk <strong>of</strong> admission into residential aged care<br />
• enhancing specialist disability services to those younger people with disability<br />
currently in residential aged care, who did not wish to move out.<br />
The program ended in June 2011 however, the <strong>Commission</strong> remains committed to<br />
continuing to improve the lives <strong>of</strong> these young people.<br />
Major achievements 2011–2012<br />
• Architect engaged and project plan developed for new emergency<br />
accommodation in Bedford.<br />
• Increased flexible community living options by promoting concept planning and<br />
implementing a differential cap on community and family living plans.<br />
• Evaluation <strong>of</strong> the Community Living Initiative resulted in redevelopment <strong>of</strong> some<br />
individual plans, increased involvement <strong>of</strong> disability service organisations and<br />
increased support for Local Area Coordinators.<br />
• The Community and Family Living Resource Team (CFLRT) was fully staffed<br />
including the appointment <strong>of</strong> a manager, which led to increased capacity to<br />
support Local Area Coordinators and disability sector organisations.<br />
• Individuals living in supported accommodation experienced stronger involvement<br />
in community and sporting groups by participating in a gym program operated by<br />
the Central Institute <strong>of</strong> Technology, the AFL Integrated League, the GymAbility<br />
program, Let’s Go Surfing Days and participation in other sporting activities.<br />
• A documentary film ‘Findings: the story <strong>of</strong> the Lost Generation Project’ was screened<br />
in Canberra and Northbridge during <strong>Disability</strong> Awareness Week. The <strong>Commission</strong> was<br />
a project partner.<br />
Looking forward: objectives for 2012–2013<br />
In 2012–2013, the <strong>Commission</strong> will:<br />
• review the current service model and accommodation type to align with changing<br />
support needs<br />
• develop and implement a health and wellbeing framework for individuals<br />
• support and fund an anticipated 50 Community Living Plans.<br />
30
2.2.2 Service 2 — Individual support<br />
Individual support includes support for people with disability to access positive and<br />
constructive day activities, maintain health and develop individual skills and abilities.<br />
In brief...<br />
17,790 people used the Individual Support service, an<br />
increase <strong>of</strong> 6.8 per cent from last year.<br />
The total cost for this financial year was $174.613 million,<br />
averaging $9,815 per person.<br />
Key strategies:<br />
• People with disability, their families and carers have access to services within the<br />
community that assist them in maintaining a good quality <strong>of</strong> life.<br />
• People with disability who have left school but are not able to work are assisted in<br />
linking with their community and to develop independence and skills to participate in<br />
activities <strong>of</strong> their choice.<br />
• People with disability receive necessary health care and therapeutic support to limit<br />
the restrictive effects <strong>of</strong> their disability, increase independence and maximise<br />
skill development.<br />
Three years at a glance<br />
Measure 2009–10 2010–11 2011–12<br />
Total service users 16,504 16,655 17,790<br />
Service reports<br />
Total service users by individual support type<br />
<strong>Disability</strong> Pr<strong>of</strong>essional<br />
<strong>Services</strong><br />
7,292 7,904 7,891<br />
Day options 4,004 4,222 4,445<br />
Community Aids and<br />
Equipment Program<br />
Average cost per<br />
service user<br />
8,046 7,618 8,834<br />
$7,162 $8,143 $9,815<br />
Total cost ($ millions) $118.20 $135.60 $174.61<br />
Consumer satisfaction 84% 82% 87%<br />
Notes:<br />
(a) The subtotals do not add up to the total due to some individuals receiving<br />
multiple services.<br />
<strong>Disability</strong> <strong>Services</strong> <strong>Commission</strong> • Annual Report 2011–2012<br />
31
Case study<br />
Community support makes a world <strong>of</strong> difference<br />
Bunbury six-year-old Kasey Goddard is getting out and about more easily<br />
these days, thanks to the generosity <strong>of</strong> her local community. Kasey has multiple<br />
disabilities and needs assistance in all aspects <strong>of</strong> her care, meaning positional and<br />
wheelchair support is necessary.<br />
“As Kasey began to outgrow her car seat, matched with a new wheelchair that was<br />
not collapsible, we needed a wheelchair-accessible vehicle,” Kasey’s mother Toni<br />
Price said.<br />
A local Bunbury newspaper picked up on their quest for a vehicle and the<br />
momentum built from there. Many local community members made donations and<br />
a magazine <strong>of</strong>fered to print Kasey’s story and provide $1,000. In July 2010, Toni was<br />
contacted by a local with fundraising experience who wanted to organise a monster<br />
garage sale.<br />
“With her assistance, we began collecting community donations,” Toni said. “We<br />
were absolutely overwhelmed—our house was overflowing with donations.<br />
The family raised more than $20,000 with a further $7,500 coming from an<br />
Independent Living Centre grant. Two large private donations took the total figure to<br />
almost $50,000.<br />
“There were so many individuals and local organisations that helped contribute<br />
to our purchase <strong>of</strong> an accessible vehicle,” Toni said. “It was a truly remarkable<br />
community response to our situation.<br />
“As well as meeting Kasey’s needs well into adulthood, the modified vehicle has<br />
greatly improved her quality <strong>of</strong> life. It’s just so much easier for the family to get out<br />
and about together.”<br />
Kasey and her<br />
mother Toni Price<br />
with their new van.<br />
32
Major achievements 2011–2012<br />
• $543,000 recurrent funding was allocated for the Wheatbelt Residential Respite<br />
Service in York providing support to young children, those with high medical support<br />
needs, challenging behaviours and with dual diagnosis.<br />
• $500,000 recurrent funding was allocated for the South East Metropolitan<br />
Residential Respite Service in Gosnells providing support to adults with all disability<br />
types, including those with high medical support needs, challenging and complex<br />
behaviours and autism.<br />
• An outcomes-based service planning approach, in partnership with service<br />
userswas trialled with 10 non-government organisations using the current funding<br />
allocation in a flexible way.<br />
• Developed a new disability sector organisation in the Pilbara region in response to<br />
increasing need.<br />
• A tender for management <strong>of</strong> the Neurological Conditions Co-ordinated Care<br />
program funding was advertised following the successful outcome <strong>of</strong> a four-year<br />
trial. The tender was used to model the <strong>Commission</strong>’s procurement processes<br />
to ensure consistency with the new whole <strong>of</strong> government policy - Delivering<br />
Community <strong>Services</strong> in Partnership.<br />
• An examination <strong>of</strong> trends in the Community and Family Living Initiative undertaken<br />
to increase disability sector organisation involvement in providing flexible family<br />
living options.<br />
• Presentations delivered to disability sector organisations about the Family and<br />
Community Living Initiative via various forums.<br />
• Evaluated the Early Childhood Development program and a report will be released in<br />
late 2012.<br />
• Provided workshops and training to increase capacity <strong>of</strong> disability sector<br />
organisations to provide flexible options.<br />
• The Grow, Achieve, Include Network (GAIN) project was developed and<br />
implemented with two disability sector organisations. Twenty young people are<br />
participating in the pilot, which aims to develop and implement career planning<br />
including work experience to lead to ongoing employment.<br />
• A review <strong>of</strong> diagnostic procedures in autism spectrum disorders undertaken in<br />
partnership with Curtin University confirmed current procedures are consistent with<br />
contemporary best practice.<br />
• Significant reduction in assessment waiting times for autism assessments in the<br />
metropolitan area.<br />
• Launched a new online training model for therapy assistants in rural and remote<br />
<strong>Western</strong> <strong>Australia</strong> to improve the efficiency <strong>of</strong> home-based autism early<br />
intervention for families.<br />
• Training resources for complex seating, autism early intervention, and wheelchair<br />
maintenance and repair were developed with the sector to support people in rural<br />
and remote areas.<br />
Service reports<br />
<strong>Disability</strong> <strong>Services</strong> <strong>Commission</strong> • Annual Report 2011–2012<br />
33
• The positive behaviour booklet – Effective Service Design was developed to outline<br />
core elements <strong>of</strong> positive and contemporary support for people who display<br />
challenging behavior.<br />
• The Positive Behaviour Teams (PBT) and the Early Years Consultancy Team were<br />
evaluated producing positive outcomes and recommendations for continuing<br />
improvement.<br />
• The <strong>Disability</strong> Aged Care Co-ordination function was reviewed and confirmed the need<br />
for a central contact person within the <strong>Commission</strong> to provide specialised information<br />
about disability, health and aged care services.<br />
• The needs and impact assessment <strong>of</strong> the Positive Behaviour Teams reviewed the<br />
cultural appropriateness and accessibility <strong>of</strong> this service for people with disability<br />
from Aboriginal and culturally and linguistically diverse backgrounds.This resulted in a<br />
commitment to create two Aboriginal Practice Leader positions.<br />
• Developed an interactive guide to support allied health students volunteering in third<br />
world countries to provide disability services.<br />
• Two <strong>Commission</strong> staff received Rotary Allied Health Pr<strong>of</strong>essional <strong>of</strong> The Year category<br />
awards.<br />
Looking forward: objectives for 2012–2013<br />
In 2012–2013, the <strong>Commission</strong> will:<br />
• support and fund an anticipated 150 Family Living Plans<br />
• review and revise the Alternatives to Employment (ATE) strategy to maximise the use <strong>of</strong><br />
funds and promote pathways to meaningful employment<br />
• launch the Voluntary Code <strong>of</strong> Practice for the Elimination <strong>of</strong> Restrictive Practices and<br />
develop a sector wide training package<br />
• develop partnerships with tertiary institutions to progress a coordinated and integrated<br />
approach to teaching positive behaviour support<br />
• follow-up on strengths and areas for development identified in the Early Childhood<br />
Development program evaluation<br />
• pilot a self-directed intervention program for early childhood services in the<br />
metropolitan area<br />
• establish a state-wide panel contract for autism assessors as a collaborative project<br />
between WA Health and the <strong>Disability</strong> <strong>Services</strong> <strong>Commission</strong><br />
• undertake a population-based study <strong>of</strong> health inequities <strong>of</strong> West <strong>Australia</strong>n adults<br />
with intellectual disability in partnership with other stakeholders<br />
• develop support systems for people with disability who are at risk <strong>of</strong> abuse and<br />
neglect in partnership with the disability sector<br />
• commence the Sporting Chance project, to improve healthy lifestyle opportunities<br />
for people with intellectual disability by promoting inclusion in community<br />
recreational programs<br />
• pilot the Children’s Continence Management and Advice Service project<br />
• establish a <strong>Disability</strong> Health Network in partnership with other stakeholders.<br />
34
2.2.3 Service 3 — Total individual coordination<br />
Total individual coordination includes supports provided under Local Area<br />
Coordination, where Local Area Coordinators assist people with disability, their<br />
families and their carers to plan, organise and access support and services which<br />
enhance their participation in, and contribution to, their local community. This<br />
includes support with information, advocacy and the development <strong>of</strong> local networks<br />
and partnerships to make local communities more inclusive and welcoming.<br />
In brief...<br />
9,445 people accessed Local Area Coordination (LAC).<br />
1,280 accessed LAC Direct Consumer Funding.<br />
The <strong>Commission</strong> expended $26.043 million or nearly four<br />
per cent <strong>of</strong> its budget on the Individual Coordination<br />
Service.<br />
Service reports<br />
Key strategies:<br />
• To provide individuals, families and carers with support and practical assistance to<br />
clarify their goals, strengths and needs.<br />
• To provide information and link people with local resources and support networks.<br />
• To assist individuals, families and carers to develop practical solutions to meet their<br />
goals and to access the supports and services they need.<br />
• To help build inclusive communities through partnership and collaboration with<br />
individuals, families and carers, local organisations and the broader community.<br />
Three years at a glance<br />
Measure 2009–10 2010–11 2011–12<br />
Total service users accessing<br />
Local Area Coordination<br />
Average cost per service<br />
user accessing Local Area<br />
Coordination<br />
8,726 9,267 9,445<br />
$2,614 $2,461 $2,757<br />
Total cost ($ millions) $22.04 $22.80 $26.04<br />
Consumer satisfaction 73% 72% 71%<br />
The number <strong>of</strong> people accessing Local Area Coordination (LAC) increased<br />
by 1.9 per cent while cost per service user increased by 12 per cent.<br />
<strong>Disability</strong> <strong>Services</strong> <strong>Commission</strong> • Annual Report 2011–2012<br />
35
Major achievements 2011–2012<br />
• A new Local Area Coordination area was trialled and evaluated in the Wheatbelt and<br />
will continue with additional supports for a further 12 months.<br />
• A new Local Area Coordination area was created in the northern metropolitan<br />
suburbs providing a localised responsive service.<br />
• Completed the review <strong>of</strong> the Community Living Initiative.<br />
• A consultation and review <strong>of</strong> the role and ratio <strong>of</strong> Local Area Coordinators resulted in<br />
a small adjustment in the ratio <strong>of</strong> Local Area Coordinator to consumers.<br />
• Implemented the Local Area Resource funding initiative, leading to increased<br />
capacity to respond to local needs.<br />
• Implemented the Local Area Coordination Training Framework and appointed a<br />
steering group to ensure quality and consistency state-wide.<br />
• Flexible Family and Community Living plans were used to support families and<br />
individuals at key transition points.<br />
• Increased flexible community living options by promoting concept planning and<br />
implementing a differential funding cap on community and family living plans which<br />
are managed by disability sector organisations.<br />
• Created a Family Living Initiative Network to support disability sector organisations<br />
to develop and manage family living plans.<br />
• Consolidated the Family and Community Living Initiative into one team with one<br />
assessment panel.<br />
• The Community and Family Living Resource Team worked closely with Local Area<br />
Coordinators and disability sector organisations to assist families planning<br />
for transition.<br />
36
Looking forward: objectives for 2012–2013<br />
In 2012–2013, the <strong>Commission</strong> will:<br />
• support the implementation <strong>of</strong> the My Way project in the Goldfields, Lower South<br />
West, Cockburn/Kwinana and Perth Hills to provide opportunities for people with<br />
disability, their families and carers to have greater choice and control over the supports<br />
and services they receive<br />
• implement a range <strong>of</strong> human resource strategies to ensure continued improvement in<br />
the level <strong>of</strong> response to individuals, families and carers<br />
• develop and implement a range <strong>of</strong> training modules within Local Area Coordination<br />
and contribute to the development <strong>of</strong> a values-based training program for all<br />
<strong>Commission</strong> staff<br />
• investigate the use <strong>of</strong> the Remote Area Strategy model across a range <strong>of</strong> broader<br />
settings as a means <strong>of</strong> providing more responsive services to Aboriginal people<br />
with disability<br />
• support implementation <strong>of</strong> an extended response to people with exceptionally<br />
complex needs through existing programs<br />
• continue developmental work to reshape planning templates for the Family and<br />
Community Living Initiative<br />
• implement the outcomes <strong>of</strong> the Community Living Initiative review.<br />
Service reports<br />
<strong>Disability</strong> <strong>Services</strong> <strong>Commission</strong> • Annual Report 2011–2012<br />
37
2.2.4 Service 4 — Family and carers support<br />
Family and carer support includes the provision <strong>of</strong> a range <strong>of</strong> flexible family support<br />
and respite services to support families and carers in their primary care-giving role.<br />
In brief...<br />
4,648 people received family and carer support.<br />
The total cost for this financial year was $64.126 million,<br />
averaging $13,796 per person.<br />
Key strategies:<br />
• Continue to develop initiatives that support carers.<br />
• Work with disability service providers to build awareness and understanding <strong>of</strong> issues<br />
and concerns facing families and carers <strong>of</strong> people with disability.<br />
• Promote leadership to enhance families and carers participation in community life.<br />
• Offer practical strategies to support carers and enable them to plan for their futures.<br />
Three years at a glance<br />
Measure 2009–10 2010–11 2011–12<br />
Total service users 4,542 4,839 4,648<br />
Total service users by family and carer support type<br />
Respite 3,169 3,291 3,488<br />
Family Support 2,173 2,147 1,713<br />
Average cost per<br />
service user<br />
$10,594 $11,018 $13,796<br />
Total cost ($ millions) $48.11 $53.31 $64.13<br />
Consumer satisfaction 82% 89% 86%<br />
Table Notes:<br />
(a) The drop in service users in family support is a result <strong>of</strong> one service provider<br />
showing a significant drop in numbers for one program due to improvements in<br />
data quality.<br />
(b) The subtotals do not add up to the total due to some individuals receiving<br />
multiple services.<br />
38
The number <strong>of</strong> families and carers who accessed family and carer support decreased<br />
by 3.9 per cent while cost per service user increased by 25.2 per cent. Based on the<br />
results <strong>of</strong> the 2011–12 consumer satisfaction survey the level <strong>of</strong> satisfaction with<br />
family and carer services has decreased by three per cent from the previous year.<br />
Major achievements 2011–2012<br />
• A total <strong>of</strong> 66 Community Living plans were supported.<br />
• A total <strong>of</strong> 148 Family Living plans were supported.<br />
• Funding was provided to the Developmental <strong>Disability</strong> Council to deliver a series <strong>of</strong><br />
positive behaviour workshops to sector staff, families, carers and individuals.<br />
• Development and endorsement <strong>of</strong> the <strong>Commission</strong>’s Reconciliation Action Plan<br />
2012–2014, which included a commitment to increasing Aboriginal employment<br />
rates.<br />
• Aboriginal business trainee program continued.<br />
• Family Support Through Mentoring project was implemented and the Safeguards<br />
and Skills training package remains under development. Twenty one families from<br />
Yanchep to Mandurah have expressed an interest in participating.<br />
• Parent satisfaction with the early intervention service provided by the Early Years<br />
Consultancy Team was evaluated and the results found high levels <strong>of</strong> satisfaction<br />
associated with family-centred outcomes.<br />
• The Caring Together training package was publicised and promoted and is now<br />
covered in local induction.<br />
Service reports<br />
Looking forward: objectives for 2012–2013<br />
In 2012–2013, the <strong>Commission</strong> will:<br />
• develop an implementation plan for the Aboriginal employment strategy.<br />
<strong>Disability</strong> <strong>Services</strong> <strong>Commission</strong> • Annual Report 2011–2012<br />
39
Case study<br />
Planning strengthens independent living<br />
Two years ago, Michael Ralston moved into his own home in Gosnells—and<br />
couldn’t be happier.<br />
“I love having my own space and being independent,” he said. “I work four days a<br />
week and living close to public transport is great because I catch the train and then<br />
cycle the rest <strong>of</strong> the way.”<br />
Michael said with a network <strong>of</strong> support around him, he feels safe and secure in his<br />
own home. A person-centred approach was used with planning revolving around<br />
Michael’s goals, aspirations and dreams. It was after a Community Living Plan<br />
presentation that Michael decided to live in his own home.<br />
Michael’s mother Ann said with the use <strong>of</strong> person-centred planning tools, her son<br />
has made informed choices to plan for his future. From living at home with his<br />
family, Michael developed the general housekeeping skills he needs to manage<br />
in his own home. He also receives some support to help with shopping and meal<br />
preparation.<br />
Michael has 24 network support members, including family and friends, who care<br />
for Michael and take an interest in his wellbeing. A working group <strong>of</strong> six people<br />
(including Michael and a facilitator) meet regularly to discuss what’s happening and<br />
what needs to be done. As a result <strong>of</strong> the planning process, Ann believes Michael is<br />
coping amazingly well since moving to his own home.<br />
“We miss him terribly but he has gained greater self-confidence and is developing<br />
the skills he needs to maintain independent living,” she said.<br />
Working group<br />
meeting with Michael<br />
Ralston, left, his<br />
mother Ann, George<br />
Simm, Michael’s<br />
father Bryan and<br />
Patricia Simm.<br />
40
2.2.5 Service 5 — Community access and inclusion<br />
Community access and inclusion includes community awareness and education<br />
about disability and the provision <strong>of</strong> support to state and local governments to ensure<br />
people with disability can access facilities, services and supports and are included in<br />
their community.<br />
In brief...<br />
136 projects were supported by the <strong>Commission</strong> to raise<br />
awareness <strong>of</strong> and facilitate community access and social<br />
inclusion for people with disability and their families.<br />
The cost for this financial year was $1.388 million,<br />
averaging $10,206 per project.<br />
Service reports<br />
Key strategies:<br />
• Develop an engagement framework that supports state and local government public<br />
authorities to translate their <strong>Disability</strong> Access and Inclusion Plans (DAIPs) into<br />
action. This initiative builds on the important foundations that lead to accessible and<br />
inclusive communities.<br />
• Continue to build on current relationships established through the Liveable Homes<br />
initiative to influence and increase the use <strong>of</strong> sustainable universal housing design.<br />
• Develop and evaluate the role <strong>of</strong> Ambassadors in promoting the priorities and<br />
messages <strong>of</strong> community inclusion in Count Me In.<br />
• Work with key public and private sector partners to increase the employment<br />
opportunities for people with disability across <strong>Western</strong> <strong>Australia</strong>.<br />
Two years at a glance<br />
Measure 2010–11 2011–12<br />
Total projects 145 136<br />
Average cost per project $11,979 $10,206<br />
Total cost ($ millions) 1.74 1.39<br />
Consumer satisfaction 74% 74%<br />
Note: Figures from previous years have been recalculated according to a new<br />
annual performance reporting framework that commenced in 2010–2011 and<br />
comparisons are not directly possible for total cost and average cost per project<br />
for 2009–2010.<br />
<strong>Disability</strong> <strong>Services</strong> <strong>Commission</strong> • Annual Report 2011–2012<br />
41
Major achievements 2011–2012<br />
• Local Government Inclusion grants totalling $900,000 developed and allocated to 20<br />
Local Government Authorities to support and promote inclusive initiatives.<br />
• Employment strategy developed to increase employment opportunities for people<br />
with disability across the public and private sectors.<br />
• Three new Count Me In Ambassadors joined the ambassador program.<br />
• <strong>Disability</strong> Awareness Week was held which included a school short film competition<br />
for high school students.<br />
• Count Me In pocket guide developed and distributed.<br />
• Launched the Liveable Homes project to improve understanding <strong>of</strong> universal design<br />
in housing. The aim is to increase the availability <strong>of</strong> accessible housing in private<br />
housing stock over time.<br />
• Developed templates for geographical analysis <strong>of</strong> disability sector capacity as part<br />
<strong>of</strong> a strategic project to support sector and government understanding <strong>of</strong> service<br />
gaps across the state.<br />
• An engagement strategy was completed to help progress the Sector Development<br />
Plan.<br />
• Sixteen Alternatives to Employment (ATE) service providers were registered for the<br />
Award Scheme Development and Accreditation Network (ASDAN). Each centre<br />
delivered person-centred modules designed to promote the development <strong>of</strong><br />
personal, social, independent living, information technology and work-related skills.<br />
• ASDAN forums were held every four months to support disability sector staff, share<br />
resources, build networks and provide peer mentoring.<br />
• Grants provided to each registered organisation for school partnerships so ATE staff<br />
could attend ASDAN training.<br />
• Aboriginal cross-cultural awareness training provided for <strong>Commission</strong> staff.<br />
42
Case study<br />
Mettle detector: positive mentoring and training outcomes<br />
George Renwick is a determined person who does not let health issues stand in the<br />
way <strong>of</strong> his main love: working with machinery.<br />
Seven years ago, George and his family moved to Torbay, a small semi-rural<br />
community between Denmark and Albany. With a lifetime <strong>of</strong> experience in metal<br />
trades, he ran a heavy equipment plant hire business in the town.<br />
Five years ago, George was diagnosed with a condition that affects speech,<br />
balance and walking and muscle coordination and now needs support to do most<br />
things.<br />
Planning with his Local Area Coordinator focused on how George could keep<br />
working in his home workshop for as long as possible. George wanted to share his<br />
experience while receiving the support he needed to continue working at home.<br />
Service reports<br />
The Local Area Coordinator contacted metal trades lecturer David Christopher<br />
at the Great Southern Institute <strong>of</strong> Technology, who happily agreed to support<br />
the teaching and mentoring approach. Pre-apprentice Jamie Kelly embraced the<br />
opportunity to do the practical component <strong>of</strong> his course with George.<br />
George mentored Jamie in a wide range <strong>of</strong> activities, including boiler-making,<br />
welding, using equipment and learning about working safely.<br />
“It was a perfect match,” George said. “Once he was capable and pr<strong>of</strong>icient, Jamie<br />
was able to handle parts <strong>of</strong> the work I could no longer manage.”<br />
For Jamie, the chance to work with someone as experienced as George was<br />
invaluable. “Through one <strong>of</strong> my industry contacts in Perth, I was able to secure a<br />
boiler-making apprenticeship for Jamie,” George said.<br />
George Renwick<br />
with Local Area<br />
Coordinator Helen<br />
Soerink in his Torbay<br />
workshop.<br />
<strong>Disability</strong> <strong>Services</strong> <strong>Commission</strong> • Annual Report 2011–2012<br />
43
Looking forward: objectives for 2012–2013<br />
In 2012–2013, the <strong>Commission</strong> will:<br />
• complete and disseminate the Sector Development Plan<br />
• review and further develop the Ambassadors program including the appointment <strong>of</strong> up<br />
to six regional Ambassadors<br />
• implement the <strong>Disability</strong> Employment Strategy across state government, local<br />
government and the private sector to increase opportunities for people with disability<br />
to access meaningful employment<br />
• continue to develop and expand the Liveable Homes initiative<br />
• continue to work with key stakeholders in culture and arts to promote and develop<br />
opportunities for inclusion <strong>of</strong> people with disability in arts and cultural experiences<br />
• work with 20 local governments to evaluate and support implementation <strong>of</strong> inclusion<br />
initiatives funded by the <strong>Commission</strong> for people with disability<br />
• work with key stakeholders to implement recommendations from the <strong>Disability</strong> Sport<br />
and Recreation Review around inclusion<br />
• review progress <strong>of</strong> the Count Me In long-term plan for people with disability and<br />
develop new strategies to further promote and engage West <strong>Australia</strong>ns.<br />
44
2.3 Quality <strong>of</strong> services<br />
2.3.1 Quality Management Framework<br />
The <strong>Commission</strong>’s Quality Management Framework has been operational since May<br />
2010. The Framework is used to measure the quality <strong>of</strong> disability services and to<br />
ensure disability sector organisations stay compliant with the <strong>Disability</strong> <strong>Services</strong><br />
Standards.<br />
Quality assessment <strong>of</strong> disability services helps the <strong>Commission</strong> to make informed<br />
decisions about continued funding and expansion <strong>of</strong> services. Information about<br />
service quality is also useful to existing and potential service users to help them<br />
choose the services they might prefer.<br />
The <strong>Commission</strong> is allocated funding to provide services in five key areas to enhance<br />
the environment and wellbeing <strong>of</strong> people with disability and their carers by the<br />
provision <strong>of</strong> necessary supports and services. The <strong>Commission</strong>’s performance<br />
and achievements for each service area are reported in Chapter 2.2 <strong>of</strong> this report.<br />
Performance measures for auditing purposes are reported in Chapter 4.2.<br />
Major achievements 2011–2012<br />
• Establishing two awards for quality aligned with the Count Me In strategy.<br />
• In response to sector feedback, the <strong>Commission</strong> made improvements to the annual<br />
self-assessment tool and the quality evaluation process.<br />
• The Local Area Coordination services are now being independently evaluated as<br />
part <strong>of</strong> the Quality Management Framework.<br />
• The <strong>Commission</strong>’s Quality Unit continued quarterly training and networking sessions<br />
for independent evaluators.<br />
• The Quality Management Framework Reference Group met every two months to<br />
advise on the ongoing development <strong>of</strong> the Quality Management Framework. The<br />
Terms <strong>of</strong> Reference were revised to involve wider representation from carers and<br />
consumers and 25 outcomes were consolidated into four.<br />
• The <strong>Commission</strong> participated in a National Working Group to progress the National<br />
Quality Framework. This included responding to a draft paper about revised National<br />
Standards for <strong>Disability</strong> <strong>Services</strong> and organising focus groups and workshops in<br />
Broome and Fitzroy Crossing directed at Aboriginal people.<br />
Quality <strong>of</strong> services<br />
<strong>Disability</strong> <strong>Services</strong> <strong>Commission</strong> • Annual Report 2011–2012<br />
45
2.3.2 Complaints handling<br />
<strong>Disability</strong> <strong>Services</strong> Standard Seven specifies that people with disability, their families<br />
and carers are free to raise, and have resolved, any complaints or disputes they may<br />
have regarding a service provider or a service. Carers can also lodge complaints in<br />
their own right under the Carers Recognition Act 2004.<br />
The <strong>Commission</strong> has a Consumer Complaints Management Policy and Procedure for<br />
responding to complaints. The <strong>Commission</strong> is committed to the principles <strong>of</strong> an<br />
accessible and responsive complaints process and continually strives to improve the<br />
levels <strong>of</strong> satisfaction for people making complaints about services.<br />
People with disability, their families and carers are encouraged and assisted by the<br />
<strong>Commission</strong> to raise any concerns they might have about a service provider or a<br />
service. They are provided with information about relevant complaints and disputes<br />
processes and have the option <strong>of</strong> raising a concern directly with the staff member<br />
providing the service or making a formal complaint to a line manager or to the<br />
Consumer Liaison Service. Complaints can be lodged online, by telephone, by letter<br />
or in person.<br />
The Consumer Liaison Service consists <strong>of</strong> the <strong>Commission</strong>’s Consumer Liaison<br />
Officer and a network <strong>of</strong> Local Consumer Liaison Officers. The Service promotes a<br />
contemporary complaints management process that is receptive, responsive and<br />
accessible to people with disability and their carers from all cultural and linguistic<br />
backgrounds.<br />
Complaints regarding disability sector organisations are handled by the individual<br />
organisations or by the Health and <strong>Disability</strong> <strong>Services</strong> Complaints Office. Information<br />
about complaints to the Health and <strong>Disability</strong> <strong>Services</strong> Complaints Office are detailed<br />
under the heading ‘External review <strong>of</strong> complaints – Health and <strong>Disability</strong> <strong>Services</strong><br />
Complaints Office’.<br />
Complaints lodged with the <strong>Disability</strong> <strong>Services</strong> <strong>Commission</strong> July<br />
2011–June 2012<br />
The following data has been retrieved from the internal complaints monitoring and<br />
collection process.<br />
• Forty-three new complaints were lodged about services the <strong>Commission</strong> provided to<br />
people with disability, 14 less (24.5 per cent) than the previous year.<br />
• Twelve complaints were carried over from the previous year, making a total <strong>of</strong> 55<br />
complaints for resolution.<br />
• Fifty complaint cases were closed and five were outstanding at 30 June 2012.<br />
• Seventy-eight per cent <strong>of</strong> complainants were satisfied with the handling <strong>of</strong> their<br />
complaint (up from 63 per cent last year), six per cent were not satisfied and the<br />
remainder did not provide a satisfaction rating.<br />
• Seventy-four per cent <strong>of</strong> complainants were satisfied with the outcome <strong>of</strong> their<br />
complaint (up from 59 per cent last year), 10 per cent were not satisfied and the<br />
remainder did not provide a rating.<br />
46
• The Consumer Liaison Officer responded to 611 enquiries about disability services,<br />
issues for people with disability in the community and complaints processes.<br />
• Forty-six per cent <strong>of</strong> formal complaints were resolved and closed within 15 working<br />
days.<br />
• The main areas <strong>of</strong> concern reported by complainants related to communication,<br />
quality <strong>of</strong> service and staff-conduct.<br />
• The types <strong>of</strong> services most frequently the subject <strong>of</strong> complaints to the <strong>Commission</strong><br />
were Local Area Coordination (26 complaints or 60 per cent) and Accommodation<br />
Support <strong>Services</strong> (nine complaints or 21 per cent). Note: four <strong>of</strong> the new complaints<br />
related to more than one service area <strong>of</strong> the <strong>Commission</strong> but each person’s<br />
complaint was only counted once.<br />
• Eighteen and a half per cent <strong>of</strong> new complaints related to compliance with the<br />
Carers Charter.<br />
Five years at a glance<br />
Measure 2007–12 2008–09 2009–10 2010–11 2011–12<br />
Enquiries to the<br />
Consumer Liaison Officer<br />
Complaints made to the<br />
Consumer Liaison Service<br />
Number <strong>of</strong> complaints<br />
closed (see note a)<br />
Number <strong>of</strong> complaints<br />
per 1000 users <strong>of</strong><br />
<strong>Commission</strong> provided<br />
services<br />
Satisfaction with<br />
complaints handling<br />
(see note b)<br />
Satisfaction with<br />
complaint outcome<br />
(see note b)<br />
466 461 515 621 611<br />
33 39 49 57 43<br />
34 36 47 51 50<br />
3.56 4.07 5.11 5.65 4.11<br />
68% 80% 72% 63% 78%<br />
53% 64% 55% 59% 74%<br />
Quality <strong>of</strong> services<br />
Table Notes:<br />
(a) The number <strong>of</strong> complaints closed was greater than the number <strong>of</strong> new<br />
complaints due to some complaints being carried across from the<br />
previous year.<br />
(b) Variation between years could be influenced by the response rate because<br />
satisfaction was calculated as a proportion <strong>of</strong> all complainants. This was<br />
regardless <strong>of</strong> whether their satisfaction was obtained and sometimes it was not<br />
possible to obtain a satisfaction rating from complainants.<br />
<strong>Disability</strong> <strong>Services</strong> <strong>Commission</strong> • Annual Report 2011–2012<br />
47
Strategies to encourage consumer feedback and utilisation <strong>of</strong> the<br />
complaints process<br />
The <strong>Commission</strong>’s Consumer Liaison Service raised awareness <strong>of</strong> the consumer<br />
complaints processes by:<br />
• publishing articles in the staff ‘Cheers’ online newsletter, the <strong>Commission</strong>’s disAbility<br />
Update magazine and the People and Communities magazine<br />
• providing information to disability sector organisations at bi-annual orientation<br />
sessions in September 2011 and March 2012<br />
• providing information and training to staff and line managers who received<br />
complaints<br />
• including information on the <strong>Commission</strong>’s web page and an online complaint facility<br />
• distributing information to consumers through correspondence regarding eligibility.<br />
External review <strong>of</strong> complaints – Health and <strong>Disability</strong> <strong>Services</strong><br />
Complaints Office<br />
The Health and <strong>Disability</strong> <strong>Services</strong> Complaints Office (HaDSCO) is an independent<br />
statutory authority providing an impartial resolution service for complaints relating to<br />
health or disability services provided in the State <strong>of</strong> <strong>Western</strong> <strong>Australia</strong>. This service is<br />
free and available to all users and providers <strong>of</strong> health or disability services.<br />
Acting impartially and in confidence, the HaDSCO reviews and reports on the reason<br />
for the complaint, undertakes investigations, suggests service improvements and<br />
advises service providers about how to effectively resolve complaints. The HaDSCO<br />
promotes leadership in the delivery <strong>of</strong> health and disability services via effective<br />
communication and supports improvement through complaint resolution.<br />
This report summarises trends in complaints received and closed under Part 6 <strong>of</strong> the<br />
<strong>Disability</strong> <strong>Services</strong> Act 1993 during 2011–2012.<br />
Forty-one new complaints were lodged with the HaDSCO in 2011–2012, with 10<br />
complaints being carried forward from the previous financial year.<br />
Of the 51 complaints examined by the HaDSCO in 2011–2012:<br />
• nine related to services provided by the <strong>Disability</strong> <strong>Services</strong> <strong>Commission</strong><br />
• thirty-two related to disability sector organisations funded by the <strong>Commission</strong><br />
• ten related to other service providers.<br />
48
Forty-seven complaints relating to the <strong>Disability</strong> <strong>Services</strong> Act 1993 were closed by<br />
the HaDSCO in 2011–2012. Sixty-eight outcomes were achieved. Refer to table<br />
below.<br />
Outcome<br />
Outcome<br />
achieved %<br />
Concern registered 42.6<br />
Other 20.6<br />
Change in procedure, practice or policy 10.3<br />
Explanation given 10.3<br />
Apology provided 5.9<br />
Referred back to provider 5.9<br />
Withdrawn by complainant 4.4<br />
Total 100<br />
Note: More than one outcome can be achieved per case.<br />
Quality <strong>of</strong> services<br />
Eighty-six issues were raised by complainants relating to the <strong>Disability</strong> <strong>Services</strong> Act<br />
1993. Refer to table below.<br />
Issue<br />
Issue<br />
raised %<br />
Service management 45.3<br />
Service access 24.4<br />
Carers Charter 14.0<br />
Decision making and choice 11.6<br />
Other 4.7<br />
Total 100<br />
Note: More than one issue can be raised per case.<br />
<strong>Disability</strong> <strong>Services</strong> <strong>Commission</strong> • Annual Report 2011–2012<br />
49
2.3.3 Consumer satisfaction survey<br />
Complaints awareness and handling<br />
As part <strong>of</strong> the annual Consumer Satisfaction Survey conducted in March 2012,<br />
a random sample <strong>of</strong> 733 clients (99 per cent <strong>of</strong> all clients) were asked a series <strong>of</strong><br />
questions about:<br />
• their awareness <strong>of</strong> the right to complain<br />
• complaints made during the past 12 months (April 2011 to March 2012).<br />
Three years at a glance<br />
Measure 2009–10 2010–11 2011–12<br />
Consumer reported awareness <strong>of</strong> the right to<br />
complain<br />
80% 83% 84%<br />
Consumer didn’t wish to complain 82% 79% 79%<br />
Consumer reported feeling unable<br />
to complain<br />
8% 9% 8%<br />
Consumer reported a complaint 10% 12% 13%<br />
50
Carer complaints<br />
Sixty-five per cent or 480 respondents to the Consumer Satisfaction Survey identified<br />
themselves as carers. They were then were asked additional questions about:<br />
• information and knowledge <strong>of</strong> the complaints process<br />
• satisfaction with complaints handling and outcome.<br />
Three years at a glance<br />
Measure 2009–10 2010–11 2011–12<br />
Carer satisfaction with complaint handling 72% 63% 60%<br />
Carer satisfaction with complaint outcome 58% 54% 55%<br />
Carer reported receiving information about<br />
complaints<br />
61% 62% 67%<br />
Carer reported awareness <strong>of</strong> their right to complain 84% 84% 84%<br />
Carer reported making at least one complaint (see<br />
note)<br />
Carer reported a cause to complain but felt unable<br />
to do so<br />
9% 8% 15%<br />
10% 13% 11%<br />
Quality <strong>of</strong> services<br />
Notes: Complaints refer to informal complaints made to staff providing the service,<br />
formal complaints made to the manager <strong>of</strong> the service, to the <strong>Commission</strong>’s<br />
Consumer Liaison Service or the Health and <strong>Disability</strong> <strong>Services</strong> Complaints<br />
Office.<br />
<strong>Disability</strong> <strong>Services</strong> <strong>Commission</strong> • Annual Report 2011–2012<br />
51
2.4 Implementing the Carers<br />
Charter<br />
Throughout 2011–2012, the <strong>Commission</strong> continued strengthening its support for<br />
carers and families <strong>of</strong> people with disability. This was driven by the <strong>Commission</strong>’s<br />
reference group that effectively oversees implementation <strong>of</strong> its responsibilities under<br />
the Carers Recognition Act 2004. The reference group was formed in 2008 and<br />
membership includes external carers and representatives from each <strong>Commission</strong><br />
directorate. Some key initiatives are provided below.<br />
• Released a training resource to increase staff knowledge <strong>of</strong> the Act. Carers WA used<br />
the resource at several training sessions for disability sector organisations.<br />
• In line with national objectives, the <strong>Commission</strong> committed to ensuring ageing<br />
carers were well supported. Under the Combined Application Process, 85 individuals<br />
with primary carers aged 70 or older were supported in at least one funding stream<br />
in 2011–2012.<br />
• Continued support for the Leeuwin Ocean Adventure Foundation, providing funding<br />
for eight young carers and 24 people with disability aged 14-25 years to participate<br />
in mainstream voyages.<br />
• Participated in national initiatives to support carers, including ongoing work through<br />
the <strong>Disability</strong> Policy and Research Working Group and input into the National<br />
<strong>Disability</strong> Strategy.<br />
As part <strong>of</strong> the annual Consumer Satisfaction Survey, 480 carers were asked a series<br />
<strong>of</strong> questions related to the Carers Charter. This was to determine the effectiveness <strong>of</strong><br />
services provided or funded by the <strong>Commission</strong> in its support <strong>of</strong> carers. The majority<br />
<strong>of</strong> carers surveyed in 2012 reported they were treated with respect and highly agreed<br />
their needs were considered; they were included in service delivery and their views<br />
were treated sensitively.<br />
52
100%<br />
Figure 3: Agreement <strong>of</strong> carers with questions related to the Carers<br />
Charter<br />
80%<br />
60%<br />
40%<br />
20%<br />
0%<br />
85%<br />
Sensitivity<br />
to carer's<br />
needs<br />
90%<br />
Sensitivity<br />
to carer's<br />
views<br />
92% 94% 95%<br />
Inclusion<br />
in service<br />
delivery<br />
Treated<br />
with<br />
respect<br />
Inclusion in<br />
assesments<br />
91%<br />
Inclusion<br />
in<br />
planning<br />
or review<br />
Implementing the Carers Charter<br />
<strong>Disability</strong> <strong>Services</strong> <strong>Commission</strong> • Annual Report 2011–2012<br />
53
2.5 Pr<strong>of</strong>ile <strong>of</strong> service users<br />
The following is a summary <strong>of</strong> the descriptive data <strong>of</strong> the <strong>Commission</strong>’s service users<br />
in 2011–2012, covering age, gender, support needs, disability pr<strong>of</strong>ile and informal care.<br />
Age<br />
The age distribution <strong>of</strong> service users is presented below. The largest group <strong>of</strong> service<br />
users receiving services funded and provided by the <strong>Commission</strong> is in the five to<br />
fourteen year age group.<br />
Figure 4: Age distribution<br />
Number <strong>of</strong> people<br />
6,000<br />
5,469<br />
5,000<br />
4,000<br />
3,679<br />
3,000<br />
2,000<br />
1,230<br />
1,970<br />
1,894<br />
2,134<br />
2,060<br />
19,09<br />
3,062<br />
1,000<br />
0<br />
0–4<br />
5–14<br />
15–24<br />
25–34<br />
35–44<br />
45–54<br />
55–64<br />
65–74<br />
75+<br />
5<br />
Unknown<br />
Age bracket<br />
Gender<br />
During 2011–2012, there were 13,236 (56.6 per cent) male service users compared<br />
with 10,152 (43.4 per cent) female service users..<br />
Support needed<br />
A majority <strong>of</strong> the <strong>Commission</strong>’s service users required support to manage and cope<br />
with daily activities. About 83 per cent <strong>of</strong> service users require support with self-care,<br />
78 per cent required support with communication and 59 per cent required support<br />
with mobility. (see note).<br />
Note: This data does not include Community Aids and Equipment Program service<br />
users as they were not required to report their level <strong>of</strong> support and it would<br />
artificially inflate the ‘not stated’ response.<br />
54
<strong>Disability</strong> pr<strong>of</strong>ile<br />
The most commonly reported disability was intellectual (49.3 per cent),<br />
followed by autism (18.4 per cent) and physical (13.6 per cent). Refer to<br />
table below.<br />
Service users primary disability<br />
number<br />
per cent<br />
Intellectual 8,803 49.3<br />
Autism 3,096 18.4<br />
Physical 2,297 13.6<br />
Psychiatric 30 0.2<br />
Neurological 824 3.9<br />
Sensory 759 4.5<br />
Acquired Brain Injury 772 4.6<br />
Other 235 1.4<br />
Not stated 530 3.2<br />
Total 16,846 -<br />
Table Notes:<br />
a) Due to missing data about the characteristics <strong>of</strong> Community Aids<br />
and Equipment Program users, the totals for these users are not<br />
included.<br />
b) The total does not add to 100 per cent due to rounding.<br />
Informal care<br />
In 2011–2012, 76 per cent <strong>of</strong> service users reported having an informal carer<br />
(Community Aids and Equipment Program service users not included).<br />
2.5.1 Annual Client and Service Data Collection online<br />
The <strong>Commission</strong> collects information about people with disability and their carers<br />
who have accessed services funded by the <strong>Commission</strong> through the Annual Client<br />
and Service Data Collection (ACDC) online system. This information is collected on<br />
an ongoing basis by each service provider and is submitted to the <strong>Commission</strong><br />
annually.<br />
Pr<strong>of</strong>ile <strong>of</strong> <strong>Commission</strong> service users<br />
In 2011–2012, ACDC collected information from 1,101 individual service outlets<br />
which provided 45,095 service records. Please note that each outlet may provide<br />
more than one type <strong>of</strong> service and each service user may use more than one service<br />
type. All but two <strong>of</strong> the disability sector organisations required to submit data, have<br />
done so and signed <strong>of</strong>f. Of the two remaining agencies, one completed their data<br />
entry but did not sign-<strong>of</strong>f the data.<br />
<strong>Disability</strong> <strong>Services</strong> <strong>Commission</strong> • Annual Report 2011–2012<br />
55
3.0 Significant issues<br />
Employment<br />
The <strong>Commission</strong> is progressing a strategy to improve employment for people with a<br />
disability. Working with relevant stakeholders, the project seeks to develop practical<br />
solutions. An important related issue is raising awareness about the benefits <strong>of</strong><br />
employing people with disability within state and local government.<br />
A two-year pilot is underway that is aimed at developing the skills and/or qualifications<br />
<strong>of</strong> young people with disability. The aim is to support them in securing and sustaining<br />
meaningful employment. The Grow, Achieve, Include Network (GAIN) project involves<br />
several young adults who receive Alternatives to Employment funding.<br />
Housing<br />
Accommodation Support Packages<br />
In May, the State Government committed $10.1 million over four years to increase the<br />
availability <strong>of</strong> accommodation services for people with disability.<br />
Social housing delivery<br />
$95.7 million was allocated in 2011 over a three year period for social housing to<br />
support people with disability. In the past 12 months the partnership between the<br />
<strong>Commission</strong> and Department <strong>of</strong> Housing acquired 95 properties from the private<br />
market and developed 20 new purpose-built houses for individuals and shared<br />
accommodation.<br />
Liveable Homes<br />
The Liveable Homes design guidelines were launched in November with a website<br />
and technical manual developed in consultation with the <strong>Western</strong> <strong>Australia</strong>n building<br />
industry. The guidelines are part <strong>of</strong> an engagement strategy to increase the number <strong>of</strong><br />
private dwellings built using universal design.<br />
In early 2012, the <strong>Commission</strong> reached agreement with the Housing Industry<br />
Association and Master Builders Association on a training strategy that targets sales<br />
staff, designers and building company owners. The <strong>Commission</strong> also worked with<br />
organisations that promote active ageing, to ensure consistency <strong>of</strong> advice across a<br />
range <strong>of</strong> consumer housing guidelines.<br />
Health and well being<br />
In June 2011, the Department <strong>of</strong> Health’s Clinical Debate held a discussion on health<br />
and disability, ‘Clinicians – Do you see me?’. Nine recommendations from that debate<br />
were endorsed by the State Health Executive Forum in December 2011.<br />
WA Health and the <strong>Commission</strong> agreed to work in partnership to implement the<br />
recommendations starting with the first – The development <strong>of</strong> a <strong>Disability</strong> Health<br />
Network. The principal goal <strong>of</strong> this Network is to improve the health outcomes for<br />
people with a disability. This outcome will be achieved through improved coordination<br />
between health services and through partnerships with other health care providers, key<br />
stakeholders, carers, consumers and the community.<br />
56
<strong>Disability</strong> Awareness Week<br />
<strong>Disability</strong> Awareness Week (28 November to 3 December) was a great success. During<br />
the week-long campaign, more than 650 people participated in events hosted by the<br />
<strong>Commission</strong>. There were more than 100 media stories generated by the <strong>Commission</strong><br />
and online social media was also effective, with 39 tweets received by at least 2,300<br />
people.<br />
<strong>Disability</strong> reform and self-directed services<br />
Several service areas <strong>of</strong> the <strong>Commission</strong> are working on projects that will contribute<br />
to a self-directed approach to service provision. The projects are expected to give<br />
consumers more control over the design, planning and delivery <strong>of</strong> their supports and<br />
services.<br />
My Way<br />
The My Way project was launched in June 2012 to focus on self-directed supports and<br />
services in four project sites over the coming year. Potential participants will be given<br />
a choice on whether they participate. The project will examine strategies to increase<br />
the level <strong>of</strong> control that individuals and families have over services and supports. The<br />
<strong>Commission</strong> is working closely with the disability sector and other community-based<br />
organisations as well as other government departments.<br />
Significant issues<br />
Procurement reforms<br />
As part <strong>of</strong> the State Government’s key contracting reform, ‘Delivering Community<br />
<strong>Services</strong> in Partnership Policy’, more than 100 disability sector organisations benefited<br />
from a 15 per cent price adjustment on all eligible not-for-pr<strong>of</strong>it service contracts. An<br />
additional funding round will be available in 2013-2014.<br />
Sector Development<br />
A Sector Development Plan is being established that will bring together information<br />
and ideas to help support the viability <strong>of</strong> the disability sector and the quality <strong>of</strong> services<br />
during a time <strong>of</strong> great change. This is being done in partnership with numerous<br />
stakeholders. It is envisaged that the end result will be a shared strategic planning and<br />
business resource that will help government and non-government organisations to<br />
meet the needs <strong>of</strong> people and their families in flexible and sustainable ways.<br />
<strong>Disability</strong> Reform and Justice<br />
The State Government has committed $18 million to establish two disability justice<br />
centres that will house people with intellectual or cognitive disability who have been<br />
accused but not convicted <strong>of</strong> a crime as they have been deemed not fit to plead.<br />
A prison in-reach service is also in development. Legislation will be introduced into<br />
<strong>Parliament</strong> to enable the centres to be operated by the <strong>Commission</strong>. This new and<br />
separate function will be a major challenge for the <strong>Commission</strong>.<br />
<strong>Disability</strong> <strong>Services</strong> <strong>Commission</strong> • Annual Report 2011–2012<br />
57
National Reform<br />
The <strong>Commission</strong> continues to be engaged in the development <strong>of</strong> a National <strong>Disability</strong><br />
Insurance Scheme (NDIS). It is an active participant in a series <strong>of</strong> working groups at<br />
a national level that are establishing the building blocks for an innovative approach.<br />
Consistency <strong>of</strong> service and certainty <strong>of</strong> funding are key issues for people with disability<br />
and the <strong>Commission</strong> continues to monitor the progress <strong>of</strong> the NDIS with regard to its<br />
establishment, eligibility criteria, ongoing funding and governance strategies that will<br />
lead to better outcomes for people with disabilities. The <strong>Commission</strong>’s work on selfdirected<br />
approaches to service provision will help shape the role <strong>Western</strong> <strong>Australia</strong><br />
might undertake in any national scheme.<br />
National <strong>Disability</strong> Strategy<br />
The <strong>Commission</strong> continues to provide leadership in <strong>Western</strong> <strong>Australia</strong> regarding the<br />
implementation <strong>of</strong> the <strong>Australia</strong>n Government’s National <strong>Disability</strong> Strategy. The<br />
<strong>Commission</strong>’s ‘Count Me In: <strong>Disability</strong> Future Directions’ and the Strategy<br />
complement each other. <strong>Western</strong> <strong>Australia</strong> is therefore well placed to contribute to<br />
the achievement <strong>of</strong> the Strategy’s outcomes to ensure a better future for people with<br />
disability.<br />
National <strong>Disability</strong> Agreement<br />
The <strong>Commission</strong> is engaged with other states and territories and the Commonwealth<br />
in working towards the objectives <strong>of</strong> the National <strong>Disability</strong> Agreement. These have<br />
included a review <strong>of</strong> the agreement indicators and aligning key reform priorities to<br />
move towards a National <strong>Disability</strong> Insurance Scheme. Under the agreement, the<br />
Commonwealth will provide additional funds to states and territories to support the<br />
work <strong>of</strong> delivering specialist disability services and ensuring that agreed national<br />
standards are maintained.<br />
National Standards for <strong>Disability</strong> <strong>Services</strong> Review<br />
The Review’s findings confirmed a need to update the concepts and language<br />
contained within the current National Standards to ensure they reflect contemporary<br />
practice. The <strong>Commission</strong> supported the revision <strong>of</strong> the National Standards by<br />
participating in a validation study. Workshops were organised in metropolitan and<br />
regional areas for service providers, evaluators and people with disability, their families<br />
and carers to provide feedback..<br />
58
4.0 Disclosures and<br />
legal compliance<br />
4.1 Financial Statements .................................................................<br />
Statement <strong>of</strong> Comprehensive Income.....................................................<br />
Statement <strong>of</strong> Financial Position...............................................................<br />
Statement <strong>of</strong> Changes in Equity..............................................................<br />
Statement <strong>of</strong> Cash Flows........................................................................<br />
Notes to the Financial Statements..........................................................<br />
4.2 Performance indicators.............................................................<br />
Opinion <strong>of</strong> the Auditor General ...............................................................<br />
Outcomes and services ..........................................................................<br />
4.3 Other financial disclosures .......................................................<br />
4.4 Governance disclosures ...........................................................<br />
4.5 Other legal requirements...........................................................<br />
4.6 Government policy requirements..............................................<br />
60<br />
62<br />
64<br />
66<br />
67<br />
68<br />
122<br />
123<br />
126<br />
136<br />
142<br />
143<br />
148<br />
Disclosures and legal compliance<br />
<strong>Disability</strong> <strong>Services</strong> <strong>Commission</strong> • Annual Report 2011–2012<br />
59
4.1 Financial statements<br />
Certification <strong>of</strong> Financial Statements for the year ended<br />
30 June 2012.<br />
The accompanying financial statements <strong>of</strong> the <strong>Disability</strong> <strong>Services</strong> <strong>Commission</strong> have<br />
been prepared in compliance with the provisions <strong>of</strong> the Financial Management Act<br />
2006 from proper accounts and records to present fairly the financial transactions for<br />
the financial year ended 30 June 2012 and the financial position as at 30 June 2012.<br />
At the date <strong>of</strong> signing we are not aware <strong>of</strong> any circumstances which would render the<br />
particulars included in the financial statements misleading or inaccurate.<br />
Bruce Langoulant<br />
Chairperson<br />
<strong>Disability</strong> <strong>Services</strong> <strong>Commission</strong> Board<br />
Shayne Silcox<br />
Deputy Chairperson<br />
<strong>Disability</strong> <strong>Services</strong> <strong>Commission</strong> Board<br />
Gary Meyers<br />
Chief Finance Officer<br />
7 September 2012<br />
60
Financial statements<br />
<strong>Disability</strong> <strong>Services</strong> <strong>Commission</strong> • Annual Report 2011–2012<br />
61
Statement <strong>of</strong> Comprehensive Income<br />
for the year ended 30 June 2012<br />
Cost <strong>of</strong> <strong>Services</strong>:<br />
Expenses<br />
Notes<br />
2012<br />
$'000<br />
2011<br />
$'000<br />
Employee benefits expenses 6 151,908 139,079<br />
Supplies and services 7 24,739 23,904<br />
Depreciation and amortisation expense 8 4,946 4,694<br />
Accommodation expenses 9 10,905 9,518<br />
Expenditure on services provided by<br />
funded agencies<br />
443,999 348,173<br />
Individual funding & other grants 15,592 12,454<br />
Loss on disposal <strong>of</strong> non-current assets 14 73 365<br />
Other expenses 10 5,307 2,959<br />
Total Cost <strong>of</strong> <strong>Services</strong> 657,469 541,146<br />
Income:<br />
Revenue<br />
User charges and fees 11 7,997 7,791<br />
Commonwealth grants and contributions 12 110,334 94,408<br />
Other revenues 13 5,891 4,639<br />
Total Revenue 124,222 106,838<br />
Total income other than income from<br />
State Government<br />
124,222 106,838<br />
Net cost <strong>of</strong> services 533,247 434,308<br />
62
Statement <strong>of</strong> Comprehensive Income<br />
for the year ended 30 June 2012 (continued)<br />
Notes<br />
Income from State Government 15<br />
2012<br />
$'000<br />
2011<br />
$'000<br />
Service appropriation 532,445 433,245<br />
Resources received free <strong>of</strong> charge 1,027 1,052<br />
Royalties for Regions Fund 147 83<br />
Total income from State Government 533,619 434,380<br />
Surplus/(deficit) for the period 372 72<br />
Other comprehensive income<br />
Changes in asset revaluation surplus 24 291 (1,128)<br />
Gains/(losses) recognised directly in equity - -<br />
Total other comprehensive income 291 (1,128)<br />
Total comprehensive income for the<br />
period<br />
663 (1,056)<br />
Table note: Refer also to note 35 'Schedule <strong>of</strong> income and expenses by service'. The<br />
statement <strong>of</strong> comprehensive income should be read in conjunction with<br />
the accompanying notes.<br />
Financial statements<br />
<strong>Disability</strong> <strong>Services</strong> <strong>Commission</strong> • Annual Report 2011–2012<br />
63
Statement <strong>of</strong> Financial Position<br />
as at 30 June 2012<br />
Assets<br />
Current assets<br />
Notes<br />
2012<br />
$'000<br />
2011<br />
$'000<br />
Cash and cash equivalents 25 2,376 663<br />
Restricted cash and cash equivalents 16,25 2,256 1,790<br />
Receivables 17 3,954 4,907<br />
Amounts receivable for services 18 - 792<br />
Total current assets 8,586 8,152<br />
Non-current assets<br />
Restricted cash and cash equivalents 16,25 4,400 3,900<br />
Amounts receivable for services 18 28,485 22,557<br />
Property, plant and equipment 19 57,865 55,632<br />
Intangible assets 20 1,894 3,133<br />
Total non-current assets 92,644 85,222<br />
Total assets 101,230 93,374<br />
64
Statement <strong>of</strong> Financial Position<br />
as at 30 June 2012 (continued)<br />
Liabilities<br />
Current Liabilities<br />
Notes<br />
2012<br />
$'000<br />
2011<br />
$'000<br />
Payables 22 5,085 4,254<br />
Provisions 23 31,398 27,493<br />
Total current liabilities 36,483 31,747<br />
Non-current liabilities<br />
Provisions 23 5,988 5,603<br />
Total non-current liabilities 5,988 5,603<br />
Total liabilities 42,471 37,350<br />
Net assets 58,759 56,024<br />
Equity 24<br />
Contributed equity 19,880 17,808<br />
Reserves 57,758 57,467<br />
Accumulated surplus/(deficit) (18,879) (19,251)<br />
Total equity 58,759 56,024<br />
Financial statements<br />
Table note: The Statement <strong>of</strong> Financial Position should be read in conjunction with the<br />
accompanying notes.<br />
<strong>Disability</strong> <strong>Services</strong> <strong>Commission</strong> • Annual Report 2011–2012<br />
65
Statement <strong>of</strong> Changes in Equity<br />
for the year ended 30 June 2012<br />
Balance at<br />
1 July 2010<br />
Notes<br />
Contributed<br />
equity<br />
$'000<br />
Reserves<br />
$'000<br />
Accumulated<br />
surplus/<br />
(deficit)<br />
$'000<br />
Total<br />
equity<br />
$'000<br />
24 16,843 58,595 (19,323) 56,115<br />
Surplus/(deficit) - - 72 72<br />
Other comprehensive<br />
income<br />
Total comprehensive<br />
income for the period<br />
- (1,128) - (1,128)<br />
- (1,128) 72 (1,056)<br />
Transactions with<br />
owners in their capacity<br />
as owners:<br />
Capital appropriations 965 - - 965<br />
Total 965 - - 965<br />
Balance at<br />
30 June 2011<br />
17,808 57,467 (19,251) 56,024<br />
Balance at<br />
1 July 2011<br />
17,808 57,467 (19,251) 56,024<br />
Surplus/(deficit) - - 372 372<br />
Other comprehensive<br />
income<br />
Total comprehensive<br />
income for<br />
the period<br />
- 291 - 291<br />
- 291 372 663<br />
Transactions with<br />
owners in their<br />
capacity as owners:<br />
Capital appropriations 2,072 - - 2,072<br />
Total 2,072 - - 2,072<br />
Balance at<br />
30 June 2012<br />
19,880 57,758 (18,879) 58,759<br />
Table note: The Statement <strong>of</strong> Changes in Equity should be read in conjunction with<br />
the accompanying notes.<br />
66
Statement <strong>of</strong> Cash Flows<br />
for the year ended 30 June 2012<br />
Cash flows from State<br />
Government<br />
Notes<br />
2012<br />
Inflows<br />
(Outflows)<br />
$'000<br />
2011<br />
Inflows<br />
(Outflows)<br />
$'000<br />
Service appropriation 526,517 427,624<br />
Capital contributions 2,072 965<br />
Holding account drawdowns 792 1,504<br />
Royalties for Regions Fund 147 83<br />
Net cash provided by State<br />
Government<br />
Utilised as follows:<br />
Cash flows from<br />
operating activities<br />
Payments<br />
529,528 430,176<br />
Employee benefits (147,792) (136,908)<br />
Payments for services provided<br />
by funded agencies<br />
(443,999) (348,173)<br />
Individual funding & other grants (15,592) (12,454)<br />
Supplies and services (38,145) (35,641)<br />
GST payments on purchases (46,935) (37,340)<br />
GST payments to taxation<br />
authority<br />
(503) (357)<br />
Financial statements<br />
Receipts<br />
Commonwealth grants and<br />
contributions<br />
110,334 94,408<br />
User charges and fees 8,039 7,787<br />
GST receipts on sales 466 400<br />
GST receipts from taxation<br />
authority<br />
47,254 37,412<br />
Other receipts 5,746 3,963<br />
Net cash provided by/(used in)<br />
operating activities<br />
25 (521,127) (426,903)<br />
<strong>Disability</strong> <strong>Services</strong> <strong>Commission</strong> • Annual Report 2011–2012<br />
67
Statement <strong>of</strong> Cash Flows<br />
for the year ended 30 June 2012 (continued)<br />
Cash flows from<br />
investing activities<br />
Payments<br />
Purchase <strong>of</strong> non-current physical<br />
assets<br />
Receipts<br />
Proceeds from sale <strong>of</strong> noncurrent<br />
physical assets<br />
Net cash provided by/(used in)<br />
investing activities<br />
Net increase/(decrease) in cash<br />
and cash equivalents<br />
Cash and cash equivalents at<br />
the beginning <strong>of</strong> period<br />
Cash and cash equivalents at<br />
the end <strong>of</strong> period<br />
Notes<br />
2012<br />
Inflows<br />
(Outflows)<br />
$'000<br />
2011<br />
Inflows<br />
(Outflows)<br />
$'000<br />
(5,722) (4,839)<br />
- -<br />
(5,722) (4,839)<br />
2,679 (1,566)<br />
6,353 7,919<br />
25 9,032 6,353<br />
Table note: The Statement <strong>of</strong> Cash Flows should be read in conjunction with the<br />
accompanying notes.<br />
Notes to the Financial Statements<br />
for the year ending 30 June 2012<br />
Note 1. <strong>Australia</strong>n Accounting Standards<br />
General<br />
The <strong>Commission</strong>’s financial statements for the year ended 30 June 2012 have been<br />
prepared in accordance with <strong>Australia</strong>n Accounting Standards. The term ‘<strong>Australia</strong>n<br />
Accounting Standards’ includes Standards and Interpretations issued by the<br />
<strong>Australia</strong>n Accounting Standards Board (AASB). The <strong>Commission</strong> has adopted any<br />
applicable new and revised <strong>Australia</strong>n Accounting Standards from their operative<br />
dates.<br />
Early adoption <strong>of</strong> standards<br />
The <strong>Commission</strong> cannot early adopt an <strong>Australia</strong>n Accounting Standard unless<br />
specifically permitted by TI 1101 ‘Application <strong>of</strong> <strong>Australia</strong>n Accounting Standards and<br />
68
Other Pronouncements’. There has been no early adoption <strong>of</strong> <strong>Australia</strong>n Accounting<br />
Standards that have been issued or amended (but not operative) by the <strong>Commission</strong><br />
for the annual reporting period ended 30 June 2012.<br />
Note 2. Summary <strong>of</strong> significant accounting policies<br />
a) General statement<br />
The <strong>Commission</strong> is a not-for-pr<strong>of</strong>it reporting entity that prepares general purpose<br />
financial statements in accordance with <strong>Australia</strong>n Accounting Standards, the<br />
Framework, Statements <strong>of</strong> Accounting Concepts and other authoritative<br />
pronouncements <strong>of</strong> the AASB as applied by the Treasurer’s instructions. Several <strong>of</strong><br />
these are modified by the Treasurer’s Instructions to vary application, disclosure,<br />
format and wording.<br />
The Financial Management Act and the Treasurer’s instructions impose legislative<br />
provisions that govern the preparation <strong>of</strong> financial statements and take precedence<br />
over <strong>Australia</strong>n Accounting Standards, the Framework, Statements <strong>of</strong> Accounting<br />
Concepts and other authoritative pronouncements <strong>of</strong> the AASB.<br />
Where modification is required and has had a material or significant financial effect<br />
upon the reported results, details <strong>of</strong> that modification and the resulting financial<br />
effect are disclosed in the notes to the financial statements.<br />
b) Basis <strong>of</strong> preparation<br />
The financial statements have been prepared on the accrual basis <strong>of</strong> accounting<br />
using the historical cost convention, except for land, buildings and infrastructure<br />
which have been measured at fair value.<br />
Financial statements<br />
The accounting policies adopted in the preparation <strong>of</strong> the financial statements have<br />
been consistently applied throughout all periods presented unless otherwise stated.<br />
The financial statements are presented in <strong>Australia</strong>n dollars and all values are<br />
rounded to the nearest thousand dollars ($'000).<br />
c) Reporting entity<br />
The reporting entity comprises the <strong>Commission</strong>.<br />
d) Contributed equity<br />
AASB Interpretation 1038 ‘Contributions by Owners Made to Wholly-Owned Public<br />
Sector Entities’ requires transfers in the nature <strong>of</strong> equity contributions, other than as<br />
a result <strong>of</strong> a restructure <strong>of</strong> administrative arrangements, to be designated by the<br />
Government (the owner) as contributions by owners (at the time <strong>of</strong>, or prior to<br />
transfer) before such transfers can be recognised as equity contributions. Capital<br />
appropriations have been designated as contributions by owners by TI 955<br />
‘Contributions by Owners made to Wholly Owned Public Sector Entities’ and have<br />
been credited directly to Contributed equity.<br />
The transfer <strong>of</strong> net assets to/from other agencies, other than as a result <strong>of</strong> a<br />
restructure <strong>of</strong> administrative arrangements, are designated as contributions by<br />
owners where the transfers are non-discretionary and non-reciprocal.<br />
<strong>Disability</strong> <strong>Services</strong> <strong>Commission</strong> • Annual Report 2011–2012<br />
69
70<br />
e) Income<br />
Revenue recognition<br />
Revenue is recognised and measured at the fair value <strong>of</strong> consideration received<br />
or receivable. The following specific recognition criteria must also be met before<br />
revenue is recognised for the major business activities as follows:<br />
Sale <strong>of</strong> goods<br />
Revenue is recognised from the sale <strong>of</strong> goods and disposal <strong>of</strong> other assets when<br />
the significant risks and rewards <strong>of</strong> ownership transfer to the purchaser and can<br />
be measured reliably.<br />
Service appropriations<br />
Service appropriations are recognised as revenues at fair value in the period in<br />
which the <strong>Commission</strong> gains control <strong>of</strong> the appropriated funds. The <strong>Commission</strong><br />
gains control <strong>of</strong> appropriated funds at the time those funds are deposited to<br />
the bank account or credited to the ‘Amounts receivable for services’ (holding<br />
account) held at Treasury.<br />
Grants, donations and other non-reciprocal contributions<br />
Revenue is recognised at fair value when the <strong>Commission</strong> obtains control over<br />
the assets comprising the contributions, usually when cash is received.<br />
Other non-reciprocal contributions that are not contributions by owners are<br />
recognised at their fair value. Contributions <strong>of</strong> services are only recognised when<br />
a fair value can be reliably determined and the services would be purchased if<br />
not donated.<br />
Royalties for Regions funds are recognised as revenue at fair value in the period<br />
in which the <strong>Commission</strong> obtains control over the funds. The <strong>Commission</strong><br />
obtains control <strong>of</strong> the funds at the time the funds are deposited into the<br />
<strong>Commission</strong>’s bank account.<br />
Gains<br />
Realised and unrealised gains are usually recognised on a net basis. These<br />
include gains arising on the disposal <strong>of</strong> non-current assets and some<br />
revaluations <strong>of</strong> non-current assets.<br />
f) Property, plant and equipment and infrastructure<br />
Capitalisation/expensing <strong>of</strong> assets<br />
Items <strong>of</strong> property, plant and equipment and infrastructure costing $5,000 or<br />
more are recognised as assets and the cost <strong>of</strong> utilising assets is expensed<br />
(depreciated) over their useful lives. Items <strong>of</strong> property, plant and equipment and<br />
infrastructure costing less than $5,000 are immediately expensed direct to the<br />
Statement <strong>of</strong> Comprehensive Income (other than where they form part <strong>of</strong> a group<br />
<strong>of</strong> similar items which are significant in total).<br />
Initial recognition and measurement<br />
Property, plant and equipment and infrastructure are initially recognised at cost.<br />
For items <strong>of</strong> property, plant and equipment acquired at no cost or for nominal<br />
cost, the cost is their fair value at the date <strong>of</strong> acquisition.
Subsequent measurement<br />
Subsequent to initial recognition as an asset, the revaluation model is used for<br />
the measurement <strong>of</strong> land and buildings and historical cost for all other property,<br />
plant and equipment. Land and buildings are carried at fair value less accumulated<br />
depreciation (buildings only) and accumulated impairment losses. All other items<br />
<strong>of</strong> property, plant and equipment are stated at historical cost less accumulated<br />
depreciation and accumulated impairment losses.<br />
Where market-based evidence is available, the fair value <strong>of</strong> land and buildings is<br />
determined on the basis <strong>of</strong> current market buying values determined by reference<br />
to recent market transactions. When buildings are revalued by reference to recent<br />
market transactions, the accumulated depreciation is eliminated against the gross<br />
carrying amount <strong>of</strong> the asset and the net amount restated to the revalued amount.<br />
In the absence <strong>of</strong> market-based evidence, the fair value <strong>of</strong> land and buildings is<br />
determined on the basis <strong>of</strong> existing use. This normally applies where buildings<br />
are specialised or where land use is restricted. Fair value for existing use assets<br />
is determined by reference to the cost <strong>of</strong> replacing the remaining future economic<br />
benefits embodied in the asset, ie. the depreciated replacement cost. Where<br />
the fair value <strong>of</strong> buildings is determined on the depreciated replacement cost<br />
basis, the gross carrying amount and the accumulated depreciation are restated<br />
proportionately.<br />
Land and buildings are independently valued annually by the <strong>Western</strong> <strong>Australia</strong>n<br />
Land Information Authority (Valuation <strong>Services</strong>) and John Stranger Partnerships<br />
respectively and recognised annually to ensure that the carrying amount does not<br />
differ materially from the asset’s fair value at the end <strong>of</strong> the reporting period.<br />
Financial statements<br />
When buildings are revalued, the accumulated depreciation is eliminated against<br />
the gross carrying amount <strong>of</strong> the asset and the net amount restated to the revalued<br />
amount.<br />
The most significant assumptions in estimating fair value are made in assessing<br />
whether to apply the existing use basis to assets and in determining estimated useful<br />
life. Pr<strong>of</strong>essional judgement by the valuer is required where the evidence does not<br />
provide a clear distinction between market type assets and existing<br />
use assets.<br />
Derecognition<br />
Upon disposal or derecognition <strong>of</strong> an item <strong>of</strong> property, plant and equipment and<br />
infrastructure, any revaluation surplus relating to that asset is retained in the asset<br />
revaluation surplus.<br />
Asset revaluation surplus<br />
The asset revaluation surplus is used to record increments and decrements on<br />
the revaluation <strong>of</strong> non-current assets as described in note 19 ‘Property, plant and<br />
equipment’.<br />
<strong>Disability</strong> <strong>Services</strong> <strong>Commission</strong> • Annual Report 2011–2012<br />
71
Depreciation<br />
All non-current assets having a limited useful life are systematically depreciated over<br />
their estimated useful lives in a manner that reflects the consumption <strong>of</strong> their future<br />
economic benefits. Land is not depreciated.<br />
Depreciation is calculated using the straight line method, using rates which are<br />
reviewed annually. Estimated useful lives for each class <strong>of</strong> depreciable asset are:<br />
Buildings<br />
Computing, <strong>of</strong>fice and other equipment<br />
Medical equipment<br />
Plant and equipment<br />
Leasehold improvements<br />
40 years<br />
5 years<br />
10 years<br />
10 years<br />
3 to 10 years<br />
g) Intangible assets<br />
Capitalisation/expensing <strong>of</strong> assets<br />
Acquisitions <strong>of</strong> intangible assets costing $5,000 or more and internally generated<br />
intangible assets costing $5,000 or more are capitalised. The cost <strong>of</strong> utilising the<br />
assets is expensed (amortised) over their useful life. Costs incurred below these<br />
thresholds are immediately expensed directly to the Statement <strong>of</strong> Comprehensive<br />
Income.<br />
Intangible assets are initially recognised at cost. For assets acquired at no cost or<br />
for nominal cost, the cost is their fair value at the date <strong>of</strong> acquisition.<br />
The cost model is applied for subsequent measurement requiring the asset to be<br />
carried at cost less any accumulated amortisation and accumulated impairment<br />
losses.<br />
Amortisation for intangible assets with finite useful lives is calculated for the period<br />
<strong>of</strong> the expected benefit (estimated useful life which is reviewed annually) on the<br />
straight line basis. All intangible assets controlled by the <strong>Commission</strong> have a finite<br />
useful life and zero residual value.<br />
The expected useful lives for each class <strong>of</strong> intangible asset are:<br />
S<strong>of</strong>tware<br />
(S<strong>of</strong>tware that is not integral to the operations<br />
<strong>of</strong> any related hardware.)<br />
Web site costs<br />
5 years<br />
5 years<br />
Computer s<strong>of</strong>tware<br />
S<strong>of</strong>tware that is an integral part <strong>of</strong> the related hardware is recognised as<br />
property, plant and equipment. S<strong>of</strong>tware that is not an integral part <strong>of</strong> the related<br />
hardware is recognised as an intangible asset. S<strong>of</strong>tware costing less than $5,000<br />
is expensed in the year <strong>of</strong> acquisition.<br />
72
Web site costs<br />
Web site costs are charged as expenses when they are incurred unless they relate<br />
to the acquisition or development <strong>of</strong> an asset when they may be capitalised and<br />
amortised. Generally, costs in relation to feasibility studies during the planning<br />
phase <strong>of</strong> a web site, and ongoing costs <strong>of</strong> maintenance during the operating phase<br />
are expensed. Costs incurred in building or enhancing a web site, to the extent that<br />
they represent probable future economic benefits that can be reliably<br />
measured, are capitalised.<br />
h) Impairment <strong>of</strong> assets<br />
Property, plant and equipment, infrastructure and intangible assets are tested<br />
for any indication <strong>of</strong> impairment at the end <strong>of</strong> each reporting period. Where there<br />
is an indication <strong>of</strong> impairment, the recoverable amount is estimated. Where the<br />
recoverable amount is less than the carrying amount, the asset is considered<br />
impaired and is written down to the recoverable amount and an impairment loss<br />
is recognised. As the <strong>Commission</strong> is a not-for-pr<strong>of</strong>it entity, unless an asset has<br />
been identified as a surplus asset, the recoverable amount is the higher <strong>of</strong> an<br />
asset’s fair value less costs to sell and depreciated replacement cost.<br />
The risk <strong>of</strong> impairment is generally limited to circumstances where an asset’s<br />
depreciation is materially understated, where the replacement cost is falling or<br />
where there is a significant change in useful life. Each relevant class <strong>of</strong> assets<br />
is reviewed annually to verify that the accumulated depreciation/amortisation<br />
reflects the level <strong>of</strong> consumption or expiration <strong>of</strong> asset’s future economic benefits<br />
and to evaluate any impairment risk from falling replacement costs.<br />
Financial statements<br />
Intangible assets with an indefinite useful life and intangible assets not yet<br />
available for use are tested for impairment at each reporting period date<br />
irrespective <strong>of</strong> whether there is any indication <strong>of</strong> impairment.<br />
The recoverable amount <strong>of</strong> assets identified as surplus assets is the higher <strong>of</strong><br />
fair value less costs to sell and the present value <strong>of</strong> future cash flows expected<br />
to be derived from the asset. Surplus assets carried at fair value have no risk<br />
<strong>of</strong> material impairment where fair value is determined by reference to marketbased<br />
evidence. Where fair value is determined by reference to depreciated<br />
replacement cost, surplus assets are at risk <strong>of</strong> impairment and the recoverable<br />
amount is measured. Surplus assets at cost are tested for indications <strong>of</strong><br />
impairments at the end <strong>of</strong> each reporting period.<br />
i) Leases<br />
The <strong>Commission</strong> has entered into a number <strong>of</strong> operating lease arrangements for<br />
its motor vehicle fleet and building leases where the lessor effectively retains all <strong>of</strong><br />
the risks and benefits incident to ownership <strong>of</strong> the items held under the operating<br />
leases. Equal instalments <strong>of</strong> the lease payments are charged to the Statement<br />
<strong>of</strong> Comprehensive Income over the lease term as this represents the pattern <strong>of</strong><br />
benefits derived form the leased properties.<br />
The <strong>Commission</strong> has no finance lease commitments.<br />
<strong>Disability</strong> <strong>Services</strong> <strong>Commission</strong> • Annual Report 2011–2012<br />
73
j) Financial instruments<br />
In addition to cash, the <strong>Commission</strong> has two categories <strong>of</strong> financial instrument:<br />
• Receivables; and<br />
• Financial liabilities measured at amortised cost<br />
Financial instruments have been disaggregated into the following classes:<br />
• Financial assets<br />
◦ ◦ Cash and cash equivalents<br />
◦ ◦ Restricted cash and cash equivalents<br />
◦ ◦ Receivables<br />
◦ ◦ Amounts receivable for services<br />
• Financial Liabilities<br />
◦ ◦ Payables<br />
Initial recognition and measurement <strong>of</strong> financial instruments is at fair value which<br />
normally equates to the transaction cost or the face value. Subsequent measurement<br />
is at amortised cost using the effective interest method.<br />
The fair value <strong>of</strong> short-term receivables and payables is the transaction cost or the<br />
face value because there is no interest rate applicable and subsequent measurement<br />
is not required as the effect <strong>of</strong> discounting is not material.<br />
k) Cash and cash equivalents<br />
For the purpose <strong>of</strong> the Statement <strong>of</strong> Cash Flows, cash and cash equivalent (and<br />
restricted cash and cash equivalent) assets comprise cash on hand.<br />
l) Accrued salaries<br />
Accrued salaries (see note o next page) represent the amount due to staff but<br />
unpaid at the end <strong>of</strong> the financial year, as the pay date for the last pay period for that<br />
financial year does not coincide with the end <strong>of</strong> the financial year. Accrued salaries<br />
are settled within a fortnight <strong>of</strong> the financial year end. The <strong>Commission</strong> considers the<br />
carrying amount <strong>of</strong> accrued salaries to be equivalent to its net fair value.<br />
m) Amounts receivable for services (holding account)<br />
The <strong>Commission</strong> receives income from the State Government partly in cash and<br />
partly as an asset (holding account receivable). The accrued amount appropriated<br />
is accessible on the emergence <strong>of</strong> the cash funding requirement to cover leave<br />
entitlements and asset replacement.<br />
n) Receivables<br />
Receivables are recognised at original invoice amount less an allowance for any<br />
uncollectible amounts (i.e. impairment).The collectability <strong>of</strong> receivables is reviewed<br />
on an ongoing basis and any receivables identified as uncollectible are written-<strong>of</strong>f<br />
against the allowance account. The allowance for uncollectible amounts (doubtful<br />
debts) is raised when there is objective evidence that the <strong>Commission</strong> will not be<br />
able to collect the debts. The carrying amount is equivalent to fair value as it is due<br />
for settlement within 30 days.<br />
74
o) Payables<br />
Payables are recognised when the <strong>Commission</strong> becomes obliged to make future<br />
payments as a result <strong>of</strong> a purchase <strong>of</strong> assets or services. The carrying amount is<br />
equivalent to fair value, as settlement is generally within 30 days.<br />
p) Provisions<br />
Provisions are liabilities <strong>of</strong> uncertain timing or amount and are recognised where<br />
there is a present legal, or constructive obligation as a result <strong>of</strong> a past event and<br />
when the outflow <strong>of</strong> resources embodying economic benefits is probable and<br />
a reliable estimate can be made <strong>of</strong> the amount <strong>of</strong> the obligation. Provisions are<br />
reviewed at the end <strong>of</strong> each reporting period.<br />
Provisions – employee benefits<br />
All annual leave and long service leave provisions are in respect <strong>of</strong> employees’<br />
services up to the end <strong>of</strong> the reporting period.<br />
• Annual leave<br />
The liability for annual leave expected to be settled within 12 months after the<br />
end <strong>of</strong> the reporting period is recognised and measured at the undiscounted<br />
amounts expected to be paid when the liability is settled.<br />
Annual leave not expected to be settled within 12 months after the reporting<br />
period is recognised and measured at the present value <strong>of</strong> amounts expected to<br />
be paid when the liabilities are settled using the remuneration rate expected to<br />
apply at the time <strong>of</strong> settlement.<br />
When assessing expected future payments consideration is given to expected<br />
future wage and salary levels including non-salary components such as employer<br />
superannuation contributions, as well as the experience <strong>of</strong> employee departures<br />
and periods <strong>of</strong> service. The expected future payments are discounted using<br />
market yields at the end <strong>of</strong> the reporting period on national government bonds<br />
with terms to maturity that match, as closely as possible, the estimated future<br />
cash outflows.<br />
The provision for annual leave is classified as a current liability as the<br />
<strong>Commission</strong> does not have an unconditional right to the defer settlement <strong>of</strong> the<br />
liability for at least 12 months after the reporting period.<br />
• Long service leave<br />
The liability for long service leave expected to be settled within 12 months after<br />
the end <strong>of</strong> the reporting period is recognised and measured at the undiscounted<br />
amounts expected to be paid when the liability is settled.<br />
Long service leave not expected to be settled within 12 months after the end <strong>of</strong><br />
the reporting period is recognised and measured at the present value <strong>of</strong> amounts<br />
expected to be paid when the liabilities are settled using the remuneration rate<br />
expected to apply at the time <strong>of</strong> settlement.<br />
Financial statements<br />
<strong>Disability</strong> <strong>Services</strong> <strong>Commission</strong> • Annual Report 2011–2012<br />
75
When assessing expected future payments, consideration is given to expected<br />
future wage and salary levels including non-salary components such as employer<br />
superannuation contributions, as well as the experience <strong>of</strong> employee departures<br />
and periods <strong>of</strong> service. The expected future payments are discounted using market<br />
yields at the end <strong>of</strong> the reporting period on national government bonds with terms to<br />
maturity that match, as closely as possible, the estimated future cash outflows.<br />
Unconditional long service leave provisions are classified as current liabilities as<br />
the <strong>Commission</strong> does not have an unconditional right to defer settlement <strong>of</strong> the<br />
liability for at least 12 months after the end <strong>of</strong> the reporting period. Preconditional<br />
and conditional long service leave provisions are classified as noncurrent liabilities<br />
because the <strong>Commission</strong> has an unconditional right to defer the settlement <strong>of</strong> the<br />
liability until the employee has completed the requisite years <strong>of</strong> service.<br />
• Superannuation<br />
The Government Employees Superannuation Board (GESB) and other funds<br />
administers public sector superannuation arrangements in <strong>Western</strong> <strong>Australia</strong> in<br />
accordance with legislative requirements. Eligibility criteria for membership in<br />
particular schemes for public sector employees varies according to<br />
commencement and implementation dates.<br />
Eligible employees contribute to the Pension Scheme, a defined benefit pension<br />
scheme closed to new members since 1987, or the Gold State Superannuation<br />
Scheme (GSS), a defined benefit lump sum scheme also closed to new members<br />
since 1995.<br />
The GSS is a defined benefit scheme for the purposes <strong>of</strong> employees and whole-<strong>of</strong>government<br />
reporting. However, it is a defined contribution plan for agency purposes<br />
because the concurrent contributions (defined contributions) made by the <strong>Commission</strong><br />
to GESB extinguishes the agency’s obligations to the related superannuation liability.<br />
The <strong>Commission</strong> has no liabilities under the Pension Scheme or the GSS. The<br />
liabilities for the unfunded Pension Scheme and the unfunded GSS transfer<br />
benefits attributable to members who transferred from the Pension Scheme, are<br />
assumed by the Treasurer. All other GSS obligations are funded by concurrent<br />
contributions made by the <strong>Commission</strong> to the GESB.<br />
Employees commencing employment prior to 16 April 2007 who were not<br />
members <strong>of</strong> either the Pension or the GSS became non-contributory members <strong>of</strong><br />
the West State Superannuation Scheme (WSS). Employees commencing<br />
employment on or after 16 April 2007 became members <strong>of</strong> the GESB Super<br />
Scheme (GESBS). Both <strong>of</strong> these schemes are accumulation schemes. From 30<br />
March 2012, existing members <strong>of</strong> the WSS or GESBS and new employees<br />
became able to choose their preferred superannuation fund. The <strong>Commission</strong><br />
makes concurrent contributions to GESB or other funds on behalf <strong>of</strong> employees<br />
in compliance with the Commonwealth Government’s Superannuation Guarantee<br />
(Administration) Act 1992. Contributions to these accumulation schemes<br />
extinguish the <strong>Commission</strong>’s liability for superannuation charges in respect <strong>of</strong><br />
employees who are not members <strong>of</strong> the Pension Scheme or GSS.<br />
76
The GESB makes all benefit payments in respect <strong>of</strong> the Pension Scheme and GSS,<br />
and is recouped from the Treasurer for the employer’s share.<br />
Provisions – other<br />
• Employment on-costs<br />
Employment on-costs, including worker’s compensation insurance, are not<br />
employee benefits and are recognised separately as liabilities and expenses<br />
when the employment to which they relate has occurred. Employment on-costs<br />
are included as part <strong>of</strong> ‘Other expenses’ and are not included as part <strong>of</strong> the<br />
<strong>Commission</strong>’s ‘Employee benefits expense’. The related liability is included in<br />
‘Employment on-costs provision’.<br />
q) Superannuation expense<br />
The superannuation expense in the Statement <strong>of</strong> Comprehensive Income<br />
comprises employer contributions paid to the GSS (concurrent contributions), WSS,<br />
the GESBS or other superannuation fund.<br />
r) Resources received free <strong>of</strong> charge or for nominal cost<br />
Resources received free <strong>of</strong> charge or for nominal cost that can be reliably measured<br />
are recognised as income at fair value. Where the resource received represents a<br />
service that the <strong>Commission</strong> would otherwise pay for, a corresponding expense is<br />
recognised. Receipts <strong>of</strong> assets are recognised in the Statement <strong>of</strong> Financial<br />
Position.<br />
Financial statements<br />
Assets or services received from other State Government agencies are separately<br />
disclosed under Income from State Government in the Statement <strong>of</strong><br />
Comprehensive Income.<br />
s) Comparative figures<br />
Comparative figures are, where appropriate, reclassified to be comparable with the<br />
figures presented in the current financial year.<br />
<strong>Disability</strong> <strong>Services</strong> <strong>Commission</strong> • Annual Report 2011–2012<br />
77
Note 3. Key sources <strong>of</strong> estimation uncertainty<br />
Key estimates and assumptions concerning the future are based on historical<br />
experience and various other factors that have a significant risk <strong>of</strong> causing a material<br />
adjustment to the carrying amount <strong>of</strong> assets and liabilities within the next financial year.<br />
Long Service Leave<br />
Several estimations and assumptions used in calculating the <strong>Commission</strong>’s long<br />
service leave provision include expected future salary rates, discount rates, employee<br />
retention rates and expected future payments. Changes in these estimations and<br />
assumptions may impact on the carrying amount <strong>of</strong> the long service leave provision.<br />
Note 4. Disclosure <strong>of</strong> changes in accounting policy and estimates<br />
Initial application <strong>of</strong> an <strong>Australia</strong>n Accounting Standard<br />
The <strong>Commission</strong> has applied the following <strong>Australia</strong>n Accounting Standards effective<br />
for annual reporting periods beginning on or after 1 July 2011 that impacted on the<br />
<strong>Commission</strong>.<br />
Title<br />
<strong>Australia</strong>n Additional Disclosures<br />
AASB 1054<br />
AASB 2009-12<br />
This Standard, in conjunction with AASB<br />
2011-1 Amendments to <strong>Australia</strong>n Accounting<br />
Standards arising from the Trans-Tasman<br />
Convergence Project, removes disclosure<br />
requirements from other<br />
Standards and incorporates them in a single<br />
Standard to achieve convergence between<br />
<strong>Australia</strong>n and New Zealand Accounting<br />
Standards. There is no financial impact.<br />
Amendments to <strong>Australia</strong>n Accounting<br />
Standards [AASB 5, 8, 108, 110, 112, 119,<br />
133, 137, 139, 1023 & 1031 and Int 2, 4, 16,<br />
1039 & 1052]<br />
This Standard makes editorial amendments<br />
to a range <strong>of</strong> <strong>Australia</strong>n Accounting<br />
Standards and Interpretations. There is no<br />
financial impact.<br />
78
Title<br />
AASB 2010-4<br />
AASB 2010-5<br />
Further Amendments to <strong>Australia</strong>n<br />
Accounting Standards arising from the Annual<br />
Improvements Project [AASB 1, 7, 101 & 134<br />
and Int 13]<br />
The amendments to AASB 7 clarify financial<br />
instrument disclosures in relation to credit<br />
risk. The carrying amount <strong>of</strong> financial assets<br />
that would otherwise be past due or impaired<br />
whose terms have been renegotiated is no<br />
longer required to be disclosed. There is no<br />
financial impact.<br />
The amendments to AASB 101 clarify the<br />
presentation <strong>of</strong> the statement <strong>of</strong> changes in<br />
equity. The disaggregation <strong>of</strong> other<br />
comprehensive income reconciling the<br />
carrying amount at the beginning and the end<br />
<strong>of</strong> the period for each component <strong>of</strong> equity<br />
can be presented in either the Statement <strong>of</strong><br />
Changes in Equity or the Notes. There is no<br />
financial impact.<br />
Amendments to <strong>Australia</strong>n Accounting<br />
Standards [AASB 1, 3, 4, 5, 101, 107, 112,<br />
118, 119, 121, 132, 133, 134, 137, 139, 140,<br />
1023 & 1038 and Int 112, 115, 127, 132 &<br />
1042]<br />
This Standard makes editorial amendments<br />
to a range <strong>of</strong> <strong>Australia</strong>n Accounting<br />
Standards and Interpretations. There is no<br />
financial impact.<br />
Amendments to <strong>Australia</strong>n Accounting<br />
Standards – Disclosures on Transfers <strong>of</strong><br />
Financial Assets [AASB 1 & 7]<br />
Financial statements<br />
AASB 2010-6<br />
This Standard introduces additional<br />
disclosure relating to transfers <strong>of</strong> financial<br />
assets in AASB 7. An entity shall disclose all<br />
transferred financial assets that are not<br />
derecognised and any continuing involvement<br />
in a transferred asset, existing at the<br />
reporting date, irrespective <strong>of</strong> when the<br />
related transfer transaction occurred. There is<br />
no financial impact.<br />
<strong>Disability</strong> <strong>Services</strong> <strong>Commission</strong> • Annual Report 2011–2012<br />
79
Title<br />
AASB 2011-1<br />
AASB 2011-5<br />
Amendments to <strong>Australia</strong>n Accounting<br />
Standards arising from the Trans-Tasman<br />
Convergence Project [AASB 1, 5, 101, 107,<br />
108, 121, 128, 132 & 134 and Int 2, 112 &<br />
113]<br />
This Standard, in conjunction with AASB<br />
1054, removes disclosure requirements from<br />
other Standards and incorporates them in<br />
a single Standard to achieve convergence<br />
between <strong>Australia</strong>n and New Zealand<br />
Accounting Standards. There is no<br />
financial impact.<br />
Amendments to <strong>Australia</strong>n Accounting<br />
Standards–Extending Relief from<br />
Consolidation, the Equity Method and<br />
Proportionate Consolidation [AASB 127, 128<br />
& 131]<br />
This Standard extends the relief from<br />
consolidation, the equity method and<br />
proportionate consolidation by removing the<br />
requirement for the consolidated financial<br />
statements prepared by the ultimate or any<br />
intermediate parent entity to be IFRS<br />
compliant, provided that the parent entity,<br />
investor or venturer and the ultimate or<br />
intermediate parent entity are not-for-pr<strong>of</strong>it<br />
non-reporting entities that comply with<br />
<strong>Australia</strong>n Accounting Standards. There is no<br />
financial impact.<br />
80
Note 5. Disclosure <strong>of</strong> changes in accounting policy and estimates<br />
Future impact <strong>of</strong> <strong>Australia</strong>n Accounting Standards not yet operative<br />
The <strong>Commission</strong> cannot early adopt an <strong>Australia</strong>n Accounting Standard unless<br />
specifically permitted by TI 1101 ‘Application <strong>of</strong> <strong>Australia</strong>n Accounting Standards<br />
and Other Pronouncements’. Consequently, the <strong>Commission</strong> has not applied early<br />
any <strong>of</strong> the following <strong>Australia</strong>n Accounting Standards that have been issued and that<br />
may impact the <strong>Commission</strong>. Where applicable, the <strong>Commission</strong> plans to apply these<br />
<strong>Australia</strong>n Accounting Standards from their application date:<br />
Title<br />
AASB 9<br />
Financial Instruments<br />
This Standard supersedes AASB 139<br />
Financial Instruments: Recognition and<br />
Measurement, introducing a number <strong>of</strong><br />
changes to accounting treatments.<br />
The Standard was reissued in December<br />
2010. The Authority has not yet determined<br />
the application or the potential impact<br />
<strong>of</strong> the Standard.<br />
Operative for<br />
reporting periods<br />
beginning on/<br />
after<br />
1 January 2013<br />
Financial statements<br />
Consolidated Financial Statements<br />
This Standard supersedes requirements<br />
under AASB 127<br />
AASB 10<br />
AASB 11<br />
Consolidated and Separate Financial<br />
Statements and Int 112 Consolidation –<br />
Special Purpose Entities, introducing a<br />
number <strong>of</strong> changes to accounting treatments.<br />
The Standard was issued in August 2011. The<br />
Authority has not yet determined the<br />
application or the potential impact <strong>of</strong> the<br />
Standard.<br />
Joint Arrangements<br />
This Standard supersedes AASB 131<br />
Interests in Joint Ventures, introducing a<br />
number <strong>of</strong> changes to accounting treatments.<br />
The Standard was issued in August 2011.<br />
The Authority has not yet determined the<br />
application or the potential impact<br />
<strong>of</strong> the Standard.<br />
1 January 2013<br />
1 January 2013<br />
<strong>Disability</strong> <strong>Services</strong> <strong>Commission</strong> • Annual Report 2011–2012<br />
81
Title<br />
AASB 12<br />
AASB 13<br />
AASB 119<br />
AASB 127<br />
Disclosure <strong>of</strong> Interests in Other Entities<br />
This Standard supersedes disclosure<br />
requirements under AASB 127 Consolidated<br />
and Separate Financial Statements, AASB<br />
128 Investments in Associates and AASB 131<br />
Interests in Joint Ventures.<br />
The Standard was issued in August 2011.<br />
The Authority has not yet determined the<br />
application or the potential impact<br />
<strong>of</strong> the Standard.<br />
Fair Value Measurement<br />
This Standard defines fair value, sets out a<br />
framework for measuring fair value and<br />
requires disclosures about fair value<br />
measurements. There is no financial impact.<br />
Employee Benefits<br />
This Standard supersedes AASB 119<br />
(October 2010). As the <strong>Commission</strong> does not<br />
operate a defined benefit plan, the impact <strong>of</strong><br />
the changes is limited to measuring annual<br />
leave as a longterm employee benefit. The<br />
resultant discounting <strong>of</strong> the annual leave<br />
benefit has an immaterial impact.<br />
Separate Financial Statements<br />
This Standard supersedes requirements<br />
under AASB 127 Consolidated and Separate<br />
Financial Statements, introducing a number<br />
<strong>of</strong> changes to accounting treatments.<br />
The Standard was issued in August 2011.<br />
The Authority has not yet determined the<br />
application or the potential impact <strong>of</strong> the<br />
Standard.<br />
Operative for<br />
reporting periods<br />
beginning on/<br />
after<br />
1 January 2013<br />
1 January 2013<br />
1 January 2013<br />
1 January 2013<br />
82
Title<br />
AASB 128<br />
AASB 1053<br />
AASB 2009-11<br />
Investments in Associates and Joint<br />
Ventures<br />
This Standard supersedes AASB 128<br />
Investments in Associates, introducing a<br />
number <strong>of</strong> changes to accounting treatments.<br />
The Standard was issued in August 2011.<br />
The Authority has not yet determined the<br />
application or the potential impact<br />
<strong>of</strong> the Standard.<br />
Application <strong>of</strong> Tiers <strong>of</strong> <strong>Australia</strong>n<br />
Accounting Standards<br />
This Standard establishes a differential<br />
financial reporting framework consisting<br />
<strong>of</strong> two tiers <strong>of</strong> reporting requirements<br />
for preparing general purpose financial<br />
statements. There is no financial impact.<br />
Amendments to <strong>Australia</strong>n Accounting<br />
Standards arising from AASB 9 [AASB 1, 3, 4,<br />
5, 7, 101,102, 108, 112, 118, 121, 127, 128,<br />
131, 132, 136, 139, 1023 & 1038 and Int 10 &<br />
12]<br />
Operative for<br />
reporting periods<br />
beginning on/<br />
after<br />
1 January 2013<br />
1 July 2013<br />
1 July 2013<br />
Financial statements<br />
[Modified by AASB 2010-7]<br />
Amendments to <strong>Australia</strong>n Accounting<br />
Standards arising from Reduced Disclosure<br />
Requirements [AASB 1, 2, 3, 5, 7, 8, 101,<br />
102,107, 108, 110, 111, 112, 116, 117, 119,<br />
121, 123, 124, 127, 128, 131, 133, 134, 136,<br />
137, 138, 140, 141, 1050 & 1052 and Int 2, 4,<br />
5, 15,17, 127, 129 & 1052]<br />
AASB 2010-2<br />
1 July 2013<br />
This Standard makes amendments to<br />
<strong>Australia</strong>n Accounting Standards and<br />
Interpretations to introduce reduced<br />
disclosure requirements for certain types <strong>of</strong><br />
entities. There is no financial impact.<br />
<strong>Disability</strong> <strong>Services</strong> <strong>Commission</strong> • Annual Report 2011–2012<br />
83
84<br />
Title<br />
AASB 2010-7<br />
AASB 2011-2<br />
AASB 2011-6<br />
Amendments to <strong>Australia</strong>n Accounting<br />
Standards arising from AASB 9 (December<br />
2010) [AASB 1, 3, 4, 5, 7, 101, 102, 108, 112,<br />
118, 120, 121, 127, 128, 131, 132, 136, 137,<br />
139, 1023 & 1038 and Int 2, 5, 10, 12, 19 &<br />
127]<br />
This Standard makes consequential<br />
amendments to other <strong>Australia</strong>n Accounting<br />
Standards and Interpretations as a result<br />
<strong>of</strong> issuing AASB 9 in December 2010.<br />
The Authority has not yet determined the<br />
application or the potential impact<br />
<strong>of</strong> the Standard.<br />
Amendments to <strong>Australia</strong>n Accounting<br />
Standards arising from the Trans-Tasman<br />
Convergence Project–Reduced Disclosure<br />
Requirements [AASB 101 & 1054]<br />
This Standard removes disclosure<br />
requirements from other Standards and<br />
incorporates them in a single Standard to<br />
achieve convergence between <strong>Australia</strong>n<br />
and New Zealand Accounting Standards for<br />
reduced disclosure reporting. There is no<br />
financial impact.<br />
Amendments to <strong>Australia</strong>n Accounting<br />
Standards–Extending Relief from<br />
Consolidation, the Equity Method and<br />
Proportionate Consolidation–Reduced<br />
Disclosure Requirements [AASB 127,<br />
128 & 131]<br />
This Standard extends the relief from<br />
consolidation, the equity method and<br />
proportionate consolidation by removing the<br />
requirement for the consolidated financial<br />
statements prepared by the ultimate or<br />
any intermediate parent entity to be IFRS<br />
compliant, provided that the parent entity,<br />
investor or venturer and the ultimate or<br />
intermediate parent entity comply with<br />
<strong>Australia</strong>n Accounting Standards or <strong>Australia</strong>n<br />
Accounting Standards–Reduced Disclosure<br />
Requirements. There is no financial impact.<br />
Operative for<br />
reporting periods<br />
beginning on/<br />
after<br />
1 January 2013<br />
1 July 2013<br />
1 July 2013
Title<br />
AASB 2011-7<br />
AASB 2011-8<br />
Amendments to <strong>Australia</strong>n Accounting<br />
Standards arising from the Consolidation and<br />
Joint Arrangements Standards [AASB 1, 2,<br />
3, 5, 7, 9, 2009-11, 101, 107, 112, 118, 121,<br />
124, 132, 133, 136, 138, 139, 1023 & 1038<br />
and Int 5, 9, 16 & 17]<br />
This Standard gives effect to consequential<br />
changes arising from the issuance <strong>of</strong> AASB<br />
10, AASB 11, AASB 127 Separate Financial<br />
Statements and AASB 128 Investments in<br />
Associates and Joint Ventures. The Authority<br />
has not yet determined the application or the<br />
potential impact <strong>of</strong> the Standard.<br />
Amendments to <strong>Australia</strong>n Accounting<br />
Standards arising from AASB 13 [AASB 1, 2,<br />
3, 4, 5, 7, 9, 2009-11, 2010-7, 101, 102, 108,<br />
110, 116, 117, 118, 119, 120, 121, 128, 131,<br />
132, 133, 134, 136, 138, 139, 140, 141, 1004,<br />
1023 & 1038 and Int 2, 4, 12, 13, 14, 17, 19,<br />
131 & 132]<br />
Operative for<br />
reporting periods<br />
beginning on/<br />
after<br />
1 January 2013<br />
1 January 2013<br />
Financial statements<br />
This Standard replaces the existing definition<br />
and fair value guidance in other <strong>Australia</strong>n<br />
Accounting Standards and Interpretations as<br />
the result <strong>of</strong> issuing AASB 13 in September<br />
2011. There is no financial impact.<br />
<strong>Disability</strong> <strong>Services</strong> <strong>Commission</strong> • Annual Report 2011–2012<br />
85
Title<br />
Operative for<br />
reporting periods<br />
beginning on/<br />
after<br />
AASB 2011-9<br />
AASB 2011-10<br />
AASB 2011-11<br />
Amendments to <strong>Australia</strong>n Accounting<br />
Standards–Presentation <strong>of</strong> Items <strong>of</strong> Other<br />
Comprehensive Income [AASB 1, 5, 7, 101,<br />
112, 120, 121, 132, 133, 134, 1039 & 1049]<br />
This Standard requires to group items<br />
presented in other comprehensive income<br />
on the basis <strong>of</strong> whether they are potentially<br />
re-classifiable to pr<strong>of</strong>it or loss subsequently<br />
(reclassification adjustments).<br />
The Authority has not yet determined the<br />
application or the potential impact<br />
<strong>of</strong> the Standard.<br />
Amendments to <strong>Australia</strong>n Accounting<br />
Standards arising from AASB 119 (September<br />
2011) [AASB 1, 8, 101, 124, 134, 1049 &<br />
2011-8 and Int 14]<br />
This Standard makes amendments to<br />
other <strong>Australia</strong>n Accounting Standards and<br />
Interpretations as a result <strong>of</strong> issuing AASB<br />
119 Employee Benefits in September 2011.<br />
The Authority has not yet determined the<br />
application or the potential impact<br />
<strong>of</strong> the Standard.<br />
Amendments to AASB 119 (September<br />
2011) arising from Reduced Disclosure<br />
Requirements<br />
This Standard gives effect to <strong>Australia</strong>n<br />
Accounting Standards–Reduced Disclosure<br />
Requirements for AASB 119 (September<br />
2011). There is no financial impact.<br />
1 July 2012<br />
1 January 2013<br />
1 July 2013<br />
86
Note 6. Employee benefits expense<br />
2012<br />
$‘000<br />
2011<br />
$‘000<br />
Wages and salaries (see note a) 139,515 127,515<br />
Superannuation–defined contribution<br />
plans (see note b)<br />
12,393 11,564<br />
Total 151,908 139,079<br />
Note (a): Includes the value <strong>of</strong> the fringe benefit to the<br />
employee plus the fringe benefits tax component,<br />
leave entitlements including superannuation<br />
contribution component.<br />
Note (b): Defined contribution plans include West State,<br />
Gold State and GESB Super Scheme (contributions<br />
paid).<br />
Table note: employment on-costs expenses such as<br />
workers’ compensation insurance are included<br />
at note 10 ‘Other expenses’.<br />
Employment on-costs liability is included at note<br />
23 ‘Provisions’.<br />
Financial statements<br />
Note 7. Supplies and services<br />
2012<br />
$‘000<br />
2011<br />
$‘000<br />
Communications 1,517 1,712<br />
Consultants and contractors 9,481 9,147<br />
Consumables 7,455 6,983<br />
Repairs and maintenance 536 554<br />
Lease rentals (motor vehicles) 3,498 3,646<br />
Travel 779 650<br />
Other 1,473 1,212<br />
Total 24,739 23,904<br />
<strong>Disability</strong> <strong>Services</strong> <strong>Commission</strong> • Annual Report 2011–2012<br />
87
Note 8. Depreciation and amortisation expense<br />
2012<br />
$‘000<br />
2011<br />
$‘000<br />
Depreciation<br />
Buildings 781 831<br />
Plant and equipment 69 74<br />
Computer equipment 787 756<br />
Medical equipment 21 16<br />
Office equipment 72 79<br />
Leasehold improvements 1,977 1,769<br />
Total depreciation 3,707 3,525<br />
Amortisation<br />
Intangible assets 1,239 1,169<br />
Total amortisation 1,239 1,169<br />
Total depreciation and amortisation 4,946 4,694<br />
Note 9. Accommodation expenses<br />
2012<br />
$‘000<br />
2011<br />
$‘000<br />
Lease rentals 7,045 6,286<br />
Repairs and maintenance 2,925 2,333<br />
Cleaning 499 415<br />
Other 436 484<br />
Total 10,905 9,518<br />
88
Note 10. Other expenses<br />
2012<br />
$‘000<br />
2011<br />
$‘000<br />
Insurance 558 455<br />
Doubtful debts expense 449 2<br />
Employment on-costs (see note) 4,288 2,480<br />
Other 12 22<br />
Total 5,307 2,959<br />
Note: Includes workers’ compensation insurance and<br />
other employment on-costs. The on-costs liability<br />
associated with the recognition <strong>of</strong> annual and long<br />
service leave liability is included at note 23 ‘Provisions’.<br />
Superannuation contributions accrued as part <strong>of</strong> the<br />
provision for leave are employee benefits and are not<br />
included in employment on-costs.<br />
Note 11. User charges and fees<br />
2012<br />
$‘000<br />
2011<br />
$‘000<br />
Board and lodging 7,997 7,791<br />
Financial statements<br />
Total 7,997 7,791<br />
Note 12. Commonwealth grants and<br />
contributions<br />
2012<br />
$‘000<br />
2011<br />
$‘000<br />
National <strong>Disability</strong> Agreement 110,267 94,294<br />
Other 67 114<br />
Total 110,334 94,408<br />
<strong>Disability</strong> <strong>Services</strong> <strong>Commission</strong> • Annual Report 2011–2012<br />
89
Note 13. Other revenue<br />
2012<br />
$‘000<br />
2011<br />
$‘000<br />
Sundry revenue 1,388 1,552<br />
Community Aids Equipment Program 1,712 1,565<br />
Executive Vehicle Scheme<br />
Contribution<br />
Government Employee Housing<br />
Authority–employee contribution<br />
Recoups from disability sector<br />
organisations<br />
69 70<br />
65 63<br />
2,657 1,389<br />
Total 5,891 4,639<br />
Note 14. Net gain/(loss) on disposal <strong>of</strong> noncurrent<br />
assets<br />
2012<br />
$‘000<br />
2011<br />
$‘000<br />
Proceeds from disposal <strong>of</strong> noncurrent<br />
assets<br />
Land, building, plant and equipment - -<br />
Costs <strong>of</strong> disposal <strong>of</strong> non-current<br />
assets<br />
Land, building, plant and equipment (73) (365)<br />
Net gain/(loss) (73) (365)<br />
90
Note 15. Income from State Government<br />
Appropriation received during the<br />
period:<br />
2012<br />
$‘000<br />
2011<br />
$‘000<br />
Service appropriation (see note a) 532,445 433,245<br />
Total 532,445 433,245<br />
Resources received free <strong>of</strong> charge<br />
(see note b).<br />
Determined on the basis <strong>of</strong> the<br />
following estimates provided by<br />
agencies:<br />
Health Department 511 636<br />
State Solicitors Office 127 83<br />
Department <strong>of</strong> Finance 389 333<br />
Total 1,027 1,052<br />
Royalties for regions fund 147 83<br />
Financial statements<br />
Total 533,619 434,380<br />
Note (a): Service appropriations fund the net cost <strong>of</strong><br />
services delivered. Appropriation revenue comprises<br />
a cash component and a receivable (asset).<br />
The receivable (holding account) comprises the<br />
depreciation expense for the year and any agreed<br />
increase in leave liability during the year.<br />
Note (b): Assets or services received free <strong>of</strong> charge or for<br />
nominal cost, are recognised revenue at fair value<br />
<strong>of</strong> the assets and/or services that can be reliably<br />
measured and which would have been purchased<br />
if they were not donated. Contributions <strong>of</strong> assets or<br />
services in the nature <strong>of</strong> contributions by owners are<br />
recognised direct to equity.<br />
<strong>Disability</strong> <strong>Services</strong> <strong>Commission</strong> • Annual Report 2011–2012<br />
91
Note 16. Restricted cash and cash equivalents<br />
Restricted cash mainly reflects funds set aside for the<br />
27th pay period in a future year, staff deferred salary<br />
scheme, donations for specific purposes, special purpose<br />
Commonwealth grants and other minor projects <strong>of</strong> a restricted<br />
nature.<br />
2012<br />
$‘000<br />
2011<br />
$‘000<br />
Current<br />
Commonwealth grants 1,500 1,100<br />
Other 756 690<br />
Total 2,256 1,790<br />
Non-current<br />
27th pay provision 4,400 3,900<br />
Total 4,400 3,900<br />
Total 6,656 5,690<br />
92
Note 17. Receivables<br />
Current<br />
2012<br />
$‘000<br />
2011<br />
$‘000<br />
Receivables 1,898 1,457<br />
Allowance for impairment <strong>of</strong><br />
receivables<br />
(663) (233)<br />
Accrued revenue 197 149<br />
GST receivable 1,816 2,098<br />
Total 3,248 3,471<br />
Prepayments 706 1,436<br />
Total 706 1,436<br />
Total Receivables 3,954 4,907<br />
Reconciliation <strong>of</strong> changes in<br />
the allowance for impairment <strong>of</strong><br />
receivables:<br />
Balance at start <strong>of</strong> period 233 231<br />
Doubtful debts expense 430 2<br />
Amounts written <strong>of</strong>f during the<br />
period<br />
Amount recovered during the<br />
period<br />
- -<br />
- -<br />
Financial statements<br />
Balance at end <strong>of</strong> period 663 233<br />
Table note: The <strong>Commission</strong> does not hold any collateral<br />
or other credit enhancements as security for<br />
receivables.<br />
<strong>Disability</strong> <strong>Services</strong> <strong>Commission</strong> • Annual Report 2011–2012<br />
93
Note 18. Amounts receivable for services<br />
(Holding Account)<br />
2012<br />
$‘000<br />
2011<br />
$‘000<br />
Current - 792<br />
Non-current 28,485 22,557<br />
Total 28,485 23,349<br />
Table note: Represents the non-cash component <strong>of</strong> service<br />
appropriations. It is restricted in that it can only<br />
be used for asset replacement or payment <strong>of</strong><br />
leave liability.<br />
Note 19. Property, plant and equipment<br />
Land<br />
2012<br />
$‘000<br />
2011<br />
$‘000<br />
At fair value (see note a next page) 21,534 21,384<br />
Total 21,534 21,384<br />
Buildings<br />
At fair value (see note b next page) 22,293 21,937<br />
Total 22,293 21,937<br />
Computing equipment<br />
At cost 8,596 6,431<br />
Accumulated depreciation (4,862) (4,075)<br />
Total 3,734 2,356<br />
Medical equipment<br />
At cost 281 200<br />
Accumulated depreciation (134) (112)<br />
Total 147 88<br />
Plant and equipment<br />
At cost 1,026 959<br />
Accumulated depreciation (724) (654)<br />
Total 302 305<br />
94
Office and other equipment<br />
2012<br />
$‘000<br />
2011<br />
$‘000<br />
At cost 538 523<br />
Accumulated depreciation (360) (289)<br />
Total 178 234<br />
Leasehold improvements<br />
At cost 14,465 13,137<br />
Accumulated depreciation (8,570) (6,824)<br />
Total 5,895 6,313<br />
Work in progress 3,782 3,015<br />
Total 57,865 55,632<br />
Note (a): Land was re-valued as at 1 July 2011 by the<br />
<strong>Western</strong> <strong>Australia</strong>n Land Information Authority<br />
(Valuation <strong>Services</strong>). The valuations were performed<br />
during the year ended 30 June 2012 and recognised<br />
at 30 June 2012. In undertaking the revaluation, fair<br />
value was determined by reference to market values<br />
for land: $17.065 million. For the remaining balance,<br />
fair value <strong>of</strong> land was determined on the basis <strong>of</strong><br />
depreciated replacement cost.<br />
Note (b): The valuation <strong>of</strong> buildings was performed in June<br />
2012 in accordance with an independent valuation<br />
by John Stranger Partnerships. Fair value has been<br />
determined on the basis <strong>of</strong> depreciated<br />
replacement value.<br />
Table note: Reconciliation <strong>of</strong> the carrying amounts <strong>of</strong><br />
property, plant and equipment at the beginning and<br />
end <strong>of</strong> the reporting period are set out in the table<br />
on the next page.<br />
Financial statements<br />
<strong>Disability</strong> <strong>Services</strong> <strong>Commission</strong> • Annual Report 2011–2012<br />
95
Land<br />
$'000<br />
Buildings<br />
$'000<br />
Computing<br />
equipment<br />
$'000<br />
Medical<br />
equipment<br />
$'000<br />
Plant and<br />
equipment<br />
$'000<br />
Office<br />
equipment<br />
$'000<br />
Leasehold<br />
improvements<br />
$'000<br />
Work in<br />
progress<br />
$'000<br />
Total<br />
$'000<br />
2012<br />
Carrying amount<br />
at start <strong>of</strong> year<br />
21,384 21,937 2,356 88 305 234 6,313 3,015 55,632<br />
Additions - - - 5 - - 18 5,699 5,722<br />
Disposals - - - - - - (304) - (304)<br />
Depreciation - (781) (787) (21) (69) (72) (1,977) - (3,707)<br />
Transfer<br />
between asset<br />
classes<br />
220 776 2,165 75 66 16 1,614 (4,932) -<br />
Revaluation<br />
increments/<br />
(decrements)<br />
(70) 361 - - - - - - 291<br />
Depreciation on<br />
disposals<br />
- - - - - - 231 - 231<br />
Carrying amount<br />
at end <strong>of</strong> year<br />
21,534 22,293 3,734 147 302 178 5,895 3,782 57,865<br />
96
Land<br />
$'000<br />
Buildings<br />
$'000<br />
Computing<br />
equipment<br />
$'000<br />
Medical<br />
equipment<br />
$'000<br />
Plant and<br />
equipment<br />
$'000<br />
Office<br />
equipment<br />
$'000<br />
Leasehold<br />
improvements<br />
$'000<br />
Work in<br />
progress<br />
$'000<br />
Total<br />
$'000<br />
2011<br />
Carrying amount<br />
at 1 July 2010<br />
21,272 24,294 2,387 104 355 289 6,219 1,963 56,883<br />
Additions - - 27 - 24 8 12 3,695 3,766<br />
Disposals (325) - - - - - (327) - (652)<br />
Depreciation - (831) (756) (16) (74) (79) (1,769) - (3,525)<br />
Transfer<br />
between classes<br />
- 39 698 - - 16 1,890 (2,643) -<br />
Revaluation<br />
increments/<br />
(decrements)<br />
437 (1,565) - - - - - - (1,128)<br />
Depreciation on<br />
disposals<br />
- - - - - - 288 - 288<br />
Carrying amount<br />
at end <strong>of</strong> year<br />
21,384 21,937 2,356 88 305 234 6,313 3,015 55,632<br />
Financial statements<br />
<strong>Disability</strong> <strong>Services</strong> <strong>Commission</strong> • Annual Report 2011–2012<br />
97
Note 20. Intangible assets<br />
Computer s<strong>of</strong>tware<br />
2012<br />
$‘000<br />
2011<br />
$‘000<br />
At cost 7,272 7,272<br />
Accumulated amortisation (5,378) (4,139)<br />
Total 1,894 3,133<br />
Reconciliation:<br />
Computer s<strong>of</strong>tware<br />
Carrying amount at start <strong>of</strong> year 3,133 3,230<br />
Additions - 1,072<br />
Amortisation expense (1,239) (1,169)<br />
Carrying amount at end <strong>of</strong> year 1,894 3,133<br />
Note 21. Impairment <strong>of</strong> assets<br />
There were no indications <strong>of</strong> impairment to property, plant and<br />
equipment and intangible assets at 30 June 2012.<br />
The <strong>Commission</strong> held no goodwill or intangible assets with an<br />
indefinite useful life during the reporting period. At the end <strong>of</strong><br />
the reporting period there were no intangible assets not yet<br />
available for use.<br />
Note 22. Payables<br />
Current<br />
2012<br />
$‘000<br />
2011<br />
$‘000<br />
Trade payables 1,362 557<br />
Accrued expenses 765 446<br />
Accrued salaries 2,958 3,251<br />
Total 5,085 4,254<br />
98
Note 23. Provisions<br />
Current<br />
Employee benefits provision:<br />
Annual leave<br />
(see note a)<br />
Long service leave<br />
(see note b next page)<br />
Accrued days <strong>of</strong>f<br />
(see note a)<br />
Public holidays<br />
(see note a)<br />
Days <strong>of</strong>f in-lieu<br />
(see note a)<br />
2012<br />
$‘000<br />
2011<br />
$‘000<br />
10,519 8,635<br />
11,590 10,618<br />
2,431 2,226<br />
3,339 2,926<br />
30 33<br />
Total 27,909 24,438<br />
Other provisions:<br />
Employment on-costs<br />
(see note c next page)<br />
3,489 3,055<br />
Total 3,489 3,055<br />
Total current 31,398 27,493<br />
Non-current<br />
Employee benefits provision:<br />
Long service leave (see note b next page) 5,366 4,980<br />
Total 5,366 4,980<br />
Other provisions:<br />
Employment on-costs<br />
(see note c next page)<br />
622 623<br />
Total 622 623<br />
Total non-current 5,988 5,603<br />
Financial statements<br />
Note (a): Leave liabilities including annual, accrued days <strong>of</strong>f and<br />
public holidays have been classified as current as there is no<br />
unconditional right to defer settlement for at least 12 months<br />
after the reporting period. Assessments indicate that actual<br />
settlement <strong>of</strong> the liabilities will occur as follows:<br />
<strong>Disability</strong> <strong>Services</strong> <strong>Commission</strong> • Annual Report 2011–2012<br />
99
Within 12 months <strong>of</strong> the end<br />
<strong>of</strong> the reporting period<br />
More than 12 months after<br />
the reporting period<br />
2012<br />
$‘000<br />
2011<br />
$‘000<br />
13,497 10,817<br />
2,822 3,003<br />
Total 16,319 13,820<br />
Note (b): Long service leave liabilities have been classified<br />
as current where there is no unconditional right to<br />
defer settlement for at least 12 months after the<br />
end <strong>of</strong> the reporting period. Assessments indicate<br />
that actual settlement <strong>of</strong> the liabilities will occur as<br />
follows:<br />
Within 12 months <strong>of</strong> the end<br />
<strong>of</strong> the reporting period<br />
More than 12 months after<br />
the reporting period<br />
2012<br />
$‘000<br />
2011<br />
$‘000<br />
3,784 3,563<br />
13,131 12,035<br />
Total 16,915 15,598<br />
Note (c): The settlement <strong>of</strong> annual and long service leave<br />
liabilities gives rise to the payment <strong>of</strong> employment<br />
on-costs including workers’ compensation<br />
insurance. The provision is the present value <strong>of</strong><br />
expected future payments.<br />
The associated expense, apart from the unwinding <strong>of</strong> the<br />
discount (finance cost), is disclosed in note 10<br />
‘Other expenses’.<br />
100
Note 24. Equity<br />
The Government holds the equity interest in the <strong>Commission</strong><br />
on behalf <strong>of</strong> the community. Equity represents the residual<br />
interest in the net assets <strong>of</strong> the <strong>Commission</strong>. The asset<br />
revaluation surplus represents that portion <strong>of</strong> equity resulting<br />
from the revaluation <strong>of</strong> non-current assets.<br />
Contributed equity<br />
2012<br />
$‘000<br />
2011<br />
$‘000<br />
Balance at start <strong>of</strong> period 17,808 16,843<br />
Contributions by owners<br />
Capital appropriation 2,072 965<br />
Total contributions by owners 2,072 965<br />
Balance at end <strong>of</strong> period 19,880 17,808<br />
Reserves<br />
Asset revaluation surplus<br />
Balance at start <strong>of</strong> year 57,467 58,595<br />
Net revaluation increments/<br />
(decrements)<br />
Land and buildings 291 (1,128)<br />
Balance at end <strong>of</strong> year 57,758 57,467<br />
Accumulated surplus/(deficit)<br />
Balance at start <strong>of</strong> year (19,251) (19,323)<br />
Result for the period 372 72<br />
Balance at end <strong>of</strong> year (18,879) (19,251)<br />
Total equity at end <strong>of</strong> period 58,759 56,024<br />
Financial statements<br />
<strong>Disability</strong> <strong>Services</strong> <strong>Commission</strong> • Annual Report 2011–2012 101
Note 25. Notes to the Statement <strong>of</strong> Cash Flows<br />
(a) Reconciliation <strong>of</strong> cash<br />
Cash at the end <strong>of</strong> the financial year as shown in the Statement <strong>of</strong> Cash Flows is<br />
reconciled to the related items in the Statement <strong>of</strong> Financial Position as follows:<br />
2012<br />
$‘000<br />
2011<br />
$‘000<br />
Cash and cash equivalents 2,376 663<br />
Restricted cash and cash equivalents (refer to note 16–page 92) 6,656 5,690<br />
Total 9,032 6,353<br />
(b) Reconciliation <strong>of</strong> net cost <strong>of</strong> services to net cash flows provided by/(used in)<br />
operating activities<br />
2012<br />
$‘000<br />
2011<br />
$‘000<br />
Net cost <strong>of</strong> services (533,247) (434,308)<br />
Non-cash items:<br />
Depreciation and amortisation expense 4,946 4,694<br />
Resources received free <strong>of</strong> charge 1,027 1,052<br />
Net (gain)/loss on sale <strong>of</strong> property, plant and equipment 73 365<br />
(Increase)/decrease in assets:<br />
Current receivables (see note a) 671 (1,372)<br />
Increase/(decrease) in liabilities:<br />
Current payables (see note b) 831 1,605<br />
Current provisions 3,905 3,928<br />
Non-current provisions 385 (2,982)<br />
Change in GST in receivables/payables (see note a) 282 115<br />
Net cash provided by/(used in) operating activities (521,127) (426,903)<br />
Note (a): This reverses out the GST in receivables and payables.<br />
Note (b): Note that the <strong>Australia</strong>n Taxation Office (ATO) receivable/payable in respect<br />
<strong>of</strong> GST and receivable/payable in respect <strong>of</strong> the sale/purchase <strong>of</strong> noncurrent<br />
assets are not included in these items as they do not form part <strong>of</strong> the<br />
reconciling items.<br />
102
Note 26. Commitments<br />
Non-cancellable operating lease<br />
commitments (motor vehicles)<br />
Commitments for minimum lease<br />
payments are payable as follows:<br />
2012<br />
$‘000<br />
2011<br />
$‘000<br />
Within 1 year 1,491 1,749<br />
Later than 1 year and not later<br />
than 5 years<br />
1,513 1,705<br />
Total 3,004 3,454<br />
Non-cancellable operating lease<br />
commitments (buildings)<br />
Within 1 year 5,271 5,463<br />
Later than 1 year and not later<br />
than 5 years<br />
14,017 14,976<br />
Later than 5 years 1,348 7,503<br />
Total 20,636 27,942<br />
Financial statements<br />
The <strong>Commission</strong> has entered into a property lease which is<br />
a non-cancellable lease with a minimum five-year-term, with<br />
rent payable monthly in advance. Contingent rent provisions<br />
within the lease agreement require the minimum lease<br />
payments shall be increased by the lower <strong>of</strong> CPI or 4% per<br />
annum. An option exists to renew the lease at the end <strong>of</strong> the<br />
initial term.<br />
Note 27. Contingent liabilities and contingent assets<br />
The <strong>Disability</strong> <strong>Services</strong> <strong>Commission</strong> has neither contingent liabilities nor assets.<br />
Contaminated sites<br />
Under the Contaminated Sites Act 2003, the <strong>Commission</strong> is required to report known<br />
and suspected contaminated sites to the Department <strong>of</strong> Environment and Conservation<br />
(DEC). In accordance with the Act, the DEC classifies these sites on the basis <strong>of</strong> risk<br />
to human health, the environment and environmental values. The <strong>Commission</strong> has no<br />
sites that are classified as contaminated sites.<br />
Note 28. Events occurring after the end <strong>of</strong> the reporting period<br />
The <strong>Commission</strong> is not aware <strong>of</strong> any events occurring after the reporting date that have<br />
significant financial effect on the financial statements.<br />
<strong>Disability</strong> <strong>Services</strong> <strong>Commission</strong> • Annual Report 2011–2012 103
Note 29. Explanatory statement<br />
Significant variations between estimates and actual results for 2012 and between the<br />
actual results for 2011 and 2012 are shown below. Significant variations are considered<br />
to be those greater than 10% or $5 million.<br />
Significant variances between estimated and actual result for 2012<br />
Expenses<br />
Employee benefits<br />
expenses (see note a)<br />
Accommodation expenses<br />
(see note b)<br />
Expenditure on services<br />
provided by funded<br />
agencies<br />
(see note c next page)<br />
Loss on disposal <strong>of</strong> noncurrent<br />
assets<br />
(see note d next page)<br />
Other expenses<br />
(see note e next page)<br />
Income<br />
Other revenues<br />
(see note f next page)<br />
Service appropriation<br />
(see note g next page)<br />
Resources received free <strong>of</strong><br />
charge<br />
(see note h next page)<br />
2012<br />
Estimates<br />
$‘000<br />
2012<br />
Actual<br />
$‘000<br />
Variance<br />
$‘000<br />
143,124 151,908 8,784<br />
9,641 10,905 1,264<br />
409,483 443,999 34,516<br />
- 73 73<br />
3,297 5,307 2,010<br />
3,000 5,891 2,891<br />
486,990 532,445 45,455<br />
1,298 1,027 (271)<br />
Note (a): Employee benefits expenses (increase <strong>of</strong> $8.784 million)<br />
Reflects wage increase in line with the Public Sector General Agreement,<br />
lower vacancy rate and the impact <strong>of</strong> the actuarial assessment on leave<br />
expenses.<br />
Note (b): Accommodation expenses (increase <strong>of</strong> $1.264 million)<br />
reflects increase in lease costs and maintenance <strong>of</strong> properties.<br />
104
Note (c): Expenditure on services provided by funded agencies (increase <strong>of</strong> $34.516<br />
million) reflects the increase in State funding to disability sector organisations<br />
under the recent Sustainable Funding and Contracting with the Not-For-Pr<strong>of</strong>it<br />
Sector Initiative.<br />
Note (d): Loss on disposal <strong>of</strong> non-current assets (increase <strong>of</strong> $0.073 million) reflects<br />
accounting loss on write-down <strong>of</strong> leasehold improvements for <strong>of</strong>fices no<br />
longer leased.<br />
Note (e): Other expenses (increase <strong>of</strong> $2.010 million) reflects increased insurance<br />
premiums.<br />
Note (f): Other revenue (increase <strong>of</strong> $2.891 million) reflects return <strong>of</strong> grants provided<br />
to disability service organisations in prior years and recoup <strong>of</strong> funds from<br />
compensable clients.<br />
Note (g): Service appropriation (increase <strong>of</strong> $45.455 million)<br />
Increase represents funding for:<br />
Sustainable Funding and Contracting<br />
with Not-For-Pr<strong>of</strong>it Sector Initiative<br />
Section 25: Department <strong>of</strong> Treasury<br />
(Sustainable Funding & Contracting-<br />
Self Managed Individuals)<br />
Section 25: Department <strong>of</strong> Education<br />
(Therapy Focus and Rocky Bay)<br />
District Allowance General<br />
Agreement 2010<br />
$‘000<br />
41,965<br />
3,395<br />
Total 45, 455<br />
65<br />
30<br />
Financial statements<br />
Note (h): Resources received free <strong>of</strong> charge (decrease <strong>of</strong> $0.271 million) reflects<br />
dental treatment provided to <strong>Disability</strong> <strong>Services</strong> <strong>Commission</strong> clients by the<br />
Department <strong>of</strong> Health (decrease <strong>of</strong> $0.424 million), Integrated Procurement<br />
<strong>Services</strong> and Government Accommodation provided by Department <strong>of</strong><br />
Finance (increase <strong>of</strong> $0.079 million) and legal services by the State Solicitor's<br />
Office (increase <strong>of</strong> $0.074 million).<br />
<strong>Disability</strong> <strong>Services</strong> <strong>Commission</strong> • Annual Report 2011–2012 105
Significant variances between actual results for 2011 and 2012<br />
Expenses<br />
Employee benefits expenses<br />
(see note a)<br />
Accommodation expense<br />
(see note b)<br />
Expenditure on services<br />
provided by funded agencies<br />
(see note c)<br />
Individual funding and other<br />
grants (see note d)<br />
Loss on disposal <strong>of</strong> noncurrent<br />
assets (see note e next<br />
page)<br />
Other expenses (see note f<br />
next page)<br />
2012<br />
Actual<br />
$‘000<br />
2011<br />
Actual<br />
$‘000<br />
Variance<br />
$‘000<br />
151,908 139,079 12,829<br />
10,905 9,518 1,387<br />
443,999 348,173 95,826<br />
15,592 12,454 3,138<br />
73 365 (292)<br />
5,307 2,959 2,348<br />
Income<br />
Commonwealth grants and<br />
contributions (see note g next<br />
page)<br />
Other revenue<br />
(see note h next page)<br />
Service appropriation<br />
(see note i next page)<br />
110,334 94,408 15,926<br />
5,891 4,639 1,252<br />
532,445 433,245 99,200<br />
Note (a): Employee benefits expenses (increase <strong>of</strong> $12.829 million) reflects wage<br />
increase in line with the Public Sector General Agreement, lower vacancy rate<br />
and the impact <strong>of</strong> the Actuarial Assessment on leave expenses.<br />
Note (b): Accommodation expense (increase <strong>of</strong> $1.387 million) reflects increase in<br />
lease costs and maintenance <strong>of</strong> properties.<br />
Note (c): Expenditure on services provided by funded agencies (increase <strong>of</strong> $95.826<br />
million) increase represents funding as part <strong>of</strong> the State Liberal Election<br />
Commitments, State Growth/Indexation, Commonwealth National <strong>Disability</strong><br />
Agreement funding and the recent Sustainable Funding and Contracting with<br />
Not-For-Pr<strong>of</strong>it Sector Initiative.<br />
Note (d): Individual funding and other grants (increase <strong>of</strong> $3.138 million) increase<br />
represents funding provided as part <strong>of</strong> the recent Sustainable Funding and<br />
Contracting with Not-for-Pr<strong>of</strong>it Sector (self-managed individuals).<br />
106
Note (e): Loss on disposal <strong>of</strong> non-current assets (decrease <strong>of</strong> $0.292 million) reflects<br />
accounting loss on write-down <strong>of</strong> leasehold improvements for <strong>of</strong>fices no<br />
longer leased.<br />
Note (f): Other expenses (increase <strong>of</strong> $2.348 million) reflects increased insurance<br />
premiums.<br />
Note (g): Commonwealth grants and contributions (increase <strong>of</strong> $15.926 million)<br />
Increase represents funding for:<br />
$‘000<br />
<strong>Disability</strong> Assistance Package 10,410<br />
Indexation 3,547<br />
Growth (per capita) 1,575<br />
Others 394<br />
Total 15,926<br />
Note (h): Other revenues (increase <strong>of</strong> $1.252 million) reflects return <strong>of</strong> grants provided<br />
to disability service organisations in prior years.<br />
Note (i): Service appropriation (increase <strong>of</strong> $99.200 million)<br />
Financial statements<br />
Increase in funding for:<br />
$‘000<br />
Sustainable Funding and Contracting with Not-For-Pr<strong>of</strong>it Sector Initiative 41,965<br />
Accommodation support and preventive services (including election<br />
commitments)<br />
27,441<br />
Non-Government Human <strong>Services</strong> Sector Indexation 13,607<br />
Salary and wages (including Public Sector General Agreement<br />
outcomes)<br />
Section 25: Sustainable Funding and Contracting with the Not-For-<br />
Pr<strong>of</strong>it Sector Initiative (self managed individuals)<br />
9,374<br />
3,395<br />
Cost escalation 2,175<br />
3% efficiency dividend 1,056<br />
Accrual appropriation 308<br />
Section 25: Department <strong>of</strong> Education (Therapy Focus and Rocky Bay) 65<br />
Total 99,386<br />
<strong>Disability</strong> <strong>Services</strong> <strong>Commission</strong> • Annual Report 2011–2012 107
Note (i): Service appropriation (increase <strong>of</strong> $99.200 million) (continued)<br />
$‘000<br />
Reduction in funding for:<br />
Global Savings Measures 113<br />
Section 25: Department <strong>of</strong> Health (Brightwater Care Group) 73<br />
186<br />
Net increase 99,200<br />
Note 30. Financial instruments<br />
(a) Financial risk management objectives and policies<br />
Financial instruments held by the <strong>Commission</strong> are cash and cash equivalents,<br />
restricted cash and cash equivalents, receivables and payables. The <strong>Commission</strong><br />
has limited exposure to financial risks. The <strong>Commission</strong>’s overall risk management<br />
program focuses on managing the risks identified below.<br />
Credit risk<br />
Credit risk arises when there is the possibility <strong>of</strong> the <strong>Commission</strong>’s receivables<br />
defaulting on their contractual obligations, resulting in financial loss to the<br />
<strong>Commission</strong>.<br />
The maximum exposure to credit risk at the end <strong>of</strong> the reporting period, in relation<br />
to each class <strong>of</strong> recognised financial assets, is the gross carrying amount <strong>of</strong> those<br />
assets inclusive <strong>of</strong> any allowance for impairment as shown in the table at Note 30(c)<br />
‘Financial Instruments Disclosures’ and Note 17 ‘Receivables’.<br />
Credit risk associated with the <strong>Commission</strong>’s financial assets is minimal because<br />
the main receivable is the amounts receivable for services (holding account). For<br />
receivables other than government, the <strong>Commission</strong> trades only with recognised,<br />
creditworthy third parties. The <strong>Commission</strong> has policies in place to ensure the sales<br />
<strong>of</strong> products and services are made to customers with an appropriate credit history.<br />
In addition, receivable balances are monitored on an ongoing basis with the result<br />
that the <strong>Commission</strong>’s exposure to bad debts is minimal. At the end <strong>of</strong> the reporting<br />
period there were no significant concentrations <strong>of</strong> credit risk.<br />
Liquidity risk<br />
Liquidity risk arises when the <strong>Commission</strong> is unable to meet its financial obligations<br />
as they fall due.<br />
The <strong>Commission</strong> is exposed to liquidity risk through its trading in the normal course<br />
<strong>of</strong> business.<br />
The <strong>Commission</strong> has appropriate procedures to manage cash flows including<br />
drawdowns <strong>of</strong> appropriations by monitoring forecast cash flows to ensure sufficient<br />
funds are available to meet its commitments.<br />
108
Market risk<br />
Market risk is the risk that changes in market prices, such as foreign exchange rates<br />
and interest rates, will affect the <strong>Commission</strong>’s income or the value <strong>of</strong> its holdings <strong>of</strong><br />
financial instruments. The <strong>Commission</strong> does not trade in foreign currency and is not<br />
materially exposed to other price risks.<br />
(b) Categories <strong>of</strong> financial instruments<br />
The carrying amounts <strong>of</strong> each <strong>of</strong> the following categories <strong>of</strong> financial assets and<br />
financial liabilities at the end <strong>of</strong> the reporting period are:<br />
Financial assets<br />
2012<br />
$‘000<br />
2011<br />
$‘000<br />
Cash and cash equivalents 2,376 663<br />
Restricted cash and cash equivalents 6,656 5,690<br />
Receivables (see note) 29,720 24,573<br />
Financial liabilities<br />
Financial liabilities measured at amortised cost 5,085 4,254<br />
Note: The amount <strong>of</strong> loans and receivables excludes GST recoverable from the ATO<br />
(statutory receivable).<br />
Financial statements<br />
(c) Financial instrument disclosures<br />
Credit risk<br />
The following table disclose the <strong>Commission</strong>’s maximum exposure to credit<br />
risk, interest rate exposures and the ageing analysis <strong>of</strong> financial assets. The<br />
<strong>Commission</strong>’s maximum exposure to credit risk at the end <strong>of</strong> the reporting period is<br />
the carrying amount <strong>of</strong> the financial assets as shown below. The table discloses the<br />
ageing <strong>of</strong> financial assets that are past due but not impaired and impaired financial<br />
assets. The table is based on information provided to senior management <strong>of</strong> the<br />
<strong>Commission</strong>.<br />
The <strong>Commission</strong> does not hold any collateral as security or other credit<br />
enhancements relating to the financial assets it holds.<br />
<strong>Disability</strong> <strong>Services</strong> <strong>Commission</strong> • Annual Report 2011–2012 109
110
(c) Financial instrument disclosures (continued)<br />
Aged analysis <strong>of</strong> financial assets<br />
Carrying<br />
amount<br />
Not past<br />
due and not<br />
impaired<br />
Up to 1<br />
month<br />
Past due but not impaired<br />
1-3<br />
months<br />
3 months<br />
–1 year<br />
1–5<br />
years<br />
More<br />
than 5<br />
years<br />
Impaired<br />
financial<br />
assets<br />
$'000 $'000 $'000 $'000 $'000 $'000 $'000 $'000<br />
2012<br />
Cash and cash equivalents 2,376 2,376 - - - - - -<br />
Restricted cash and cash<br />
equivalents<br />
Receivables<br />
(see note)<br />
6,656 6,656 - - - - - -<br />
1,235 128 65 371 290 381 - 663<br />
Amounts receivable for services 28,485 28,485 - - - - - -<br />
Total 38,752 37,645 65 371 290 381 - 663<br />
2011<br />
Cash and cash equivalents 663 663 - - - - - -<br />
Restricted cash and cash<br />
equivalents<br />
Receivables<br />
(see note)<br />
5,690 5,690 - - - - - -<br />
1,224 356 204 382 175 107 - 233<br />
Amounts receivable for services 23,349 23,349 - - - - - -<br />
Total 30,926 30,058 204 382 175 107 - 233<br />
Note: The amount <strong>of</strong> receivables excludes the GST recoverable from the ATO (statutory receivable).<br />
Financial statements<br />
<strong>Disability</strong> <strong>Services</strong> <strong>Commission</strong> • Annual Report 2011–2012 111
Liquidity risk and interest rate exposure<br />
The following table details the <strong>Commission</strong>’s interest rate exposure and the contractual maturity analysis for financial assets and<br />
financial liabilities. The maturity analysis section includes interest and principal cash flows. The interest rate exposure section<br />
analyses only the carrying amount <strong>of</strong> each item.<br />
Interest rate exposure and maturity analysis <strong>of</strong> financial assets and financial liabilities<br />
Weighted<br />
average<br />
effective<br />
interest<br />
rate<br />
Carrying<br />
amount<br />
Fixed<br />
interest<br />
rate<br />
Interest rate<br />
exposure<br />
Variable<br />
interest<br />
rate<br />
Noninterest<br />
bearing<br />
Nominal<br />
amount<br />
Up to 1<br />
month<br />
1–3<br />
months<br />
Maturity dates<br />
3<br />
months<br />
–1 year<br />
1–5<br />
years<br />
More<br />
than 5<br />
years<br />
% $'000 $'000 $'000 $'000 $'000 $'000 $'000 $'000 $'000 $'000<br />
2012<br />
Financial assets<br />
Cash and cash<br />
equivalents<br />
- 2,376 - - 2,376 2,376 2,376 - - - -<br />
Restricted cash and<br />
cash equivalents<br />
- 6,656 - - 6,656 6,656 6,656 - - - -<br />
Receivables<br />
(see note)<br />
- 1,235 - - 1,235 1,235 1,235 - - - -<br />
Amounts receivable<br />
for services<br />
- 28,485 - - 28,485 28,485 28,485 - - - -<br />
Total - 38,752 - - 38,752 38,752 38,752 - - - -<br />
Financial liabilities<br />
Payables - 5,085 - - 5,085 5,085 5,085 - - - -<br />
Total - 5,085 - - 5,085 5,085 5,085 - - - -<br />
Note: The amount <strong>of</strong> receivables excludes the GST recoverable from the ATO (statutory receivable).<br />
112
Interest rate exposure and maturity analysis <strong>of</strong> financial assets and financial liabilities<br />
Weighted<br />
average<br />
effective<br />
interest<br />
rate<br />
Carrying<br />
amount<br />
Fixed<br />
interest<br />
rate<br />
Interest rate<br />
exposure<br />
Variable<br />
interest<br />
rate<br />
Noninterest<br />
bearing<br />
Nominal<br />
Amount<br />
Up to 1<br />
month<br />
1– 3<br />
months<br />
Maturity dates<br />
3<br />
months<br />
–1 year<br />
1–5<br />
years<br />
More<br />
than 5<br />
years<br />
% $'000 $'000 $'000 $'000 $'000 $'000 $'000 $'000 $'000 $'000<br />
2011<br />
Financial assets<br />
Cash and cash<br />
equivalents<br />
- 663 - - 663 663 663 - - - -<br />
Restricted cash and<br />
cash equivalents<br />
- 5,690 - - 5,690 5,690 5,690 - - - -<br />
Receivables<br />
(see note)<br />
- 1,224 - - 1,224 1,224 1,224 - - - -<br />
Amounts receivable<br />
for services<br />
- 23,349 - - 23,349 23,349 23,349 - - - -<br />
Total - 30,926 - - 30,926 30,926 30,926 - - - -<br />
Financial liabilities<br />
Payables - 4,254 - - 4,254 4,254 4,254 - - - -<br />
Total - 4,254 - - 4,254 4,254 4,254 - - - -<br />
Note: The amount <strong>of</strong> receivables excludes the GST recoverable from the ATO (statutory receivable).<br />
Financial statements<br />
<strong>Disability</strong> <strong>Services</strong> <strong>Commission</strong> • Annual Report 2011–2012 113
Fair values<br />
All financial assets and liabilities recognised in the Statement <strong>of</strong> Financial Position,<br />
whether they are carried at cost or fair value, are recognised at amounts that<br />
represent a reasonable approximation <strong>of</strong> fair value unless otherwise stated in the<br />
applicable notes.<br />
Note 31. Remuneration <strong>of</strong> members <strong>of</strong> the accountable authority<br />
and senior <strong>of</strong>ficers<br />
Remuneration on members <strong>of</strong> the accountable authority<br />
The number <strong>of</strong> members <strong>of</strong> the accountable authority, whose total <strong>of</strong> fees, salaries,<br />
superannuation, non-monetary benefits and other benefits for the financial year, fall<br />
within the following bands are:<br />
$ 2012 2011<br />
0–10,000 8 9<br />
10,001–20,000 - 1<br />
30,001–40,000 1 1<br />
Total 9 11<br />
The total remuneration <strong>of</strong> the<br />
members <strong>of</strong> the accountable<br />
authority<br />
$'000<br />
$'000<br />
57 73<br />
The total remuneration includes the superannuation expense incurred by the<br />
<strong>Commission</strong> in respect <strong>of</strong> members <strong>of</strong> the accountable authority.<br />
No members <strong>of</strong> the accountable authority are members <strong>of</strong> the pension scheme.<br />
114
Remuneration <strong>of</strong> senior <strong>of</strong>ficers<br />
The number <strong>of</strong> senior <strong>of</strong>ficers, other than senior <strong>of</strong>ficers reported as members <strong>of</strong> the<br />
Accountable authority, whose total fees, salaries, superannuation, non-monetary<br />
benefits and other benefits for the financial year fall within the following bands are:<br />
The total remuneration <strong>of</strong> senior<br />
<strong>of</strong>ficers<br />
$ 2012 2011<br />
20,001– 30,000 - 2<br />
110,001–120,000 2 -<br />
120,001–130,000 - 1<br />
140,001–150,000 1 1<br />
150,001–160,000 2 4<br />
160,001–170,000 1 2<br />
170,001–180,000 3 -<br />
180,001–190,000 2 1<br />
340,001–350,000 - 1<br />
380,001–390,000 1 -<br />
Total 12 12<br />
$'000<br />
$'000<br />
2,133 1,800<br />
The total remuneration includes the superannuation expense incurred by the<br />
<strong>Commission</strong> in respect <strong>of</strong> senior <strong>of</strong>ficers other than senior <strong>of</strong>ficers reported as<br />
members <strong>of</strong> the accountable authority.<br />
Financial statements<br />
No senior <strong>of</strong>ficers are members <strong>of</strong> the pension scheme.<br />
Note 32. Remuneration <strong>of</strong> auditor<br />
Remuneration paid or payable to the Auditor General in<br />
respect <strong>of</strong> the audit for the current financial year is as follows:<br />
Auditing the accounts, financial<br />
statements and performance<br />
indicators<br />
2012<br />
$'000<br />
2011<br />
$'000<br />
93 88<br />
<strong>Disability</strong> <strong>Services</strong> <strong>Commission</strong> • Annual Report 2011–2012 115
Note 33. Affiliated bodies<br />
The ollowing organisations received more than half their funding and resources from<br />
the <strong>Commission</strong> but are not subject to operational control by the <strong>Commission</strong>.<br />
Name <strong>of</strong> Organisation<br />
2012<br />
$'000<br />
2011<br />
$'000<br />
ATLAS Inc 58 60<br />
Autism Association <strong>of</strong> WA Inc. 23,534 16,866<br />
Belmont Districts Family and Individual Support Association<br />
Inc.<br />
81 67<br />
BGSR Pty Ltd Supported Accommodation <strong>Services</strong> 3,741 3,210<br />
Blind Citizens WA Inc. 22 18<br />
Community Living Association (formerly Lower Great<br />
Southern CLA)<br />
7,549 5,343<br />
Crosslinks Inc. 5,334 4,478<br />
Development <strong>Disability</strong> Council <strong>of</strong> WA 273 633<br />
Directions Family Support Association (ex Heritage I&FSA) 1,972 1,405<br />
ELBA Inc. 6,369 5,186<br />
Enable Southwest Inc (formerly SWFSA) 6,237 3,866<br />
Family Support WA Inc (formerly Landsdale Family Support<br />
Association)<br />
1,853 1,386<br />
Goldfields Individual and Family Support Association Inc. 3,305 2,692<br />
Headwest (Brain Injury Association <strong>of</strong> WA Inc.) 389 302<br />
i.d.entity.w.a. 19,620 15,100<br />
Inclusion WA Inc. (formerly Recreation and Sport Network Inc.) 1,307 1,251<br />
Interchange Inc. 4,170 2,673<br />
ISADD WA Pty Ltd 830 768<br />
Kalparrin Centre (PMH) 468 205<br />
Kids Camp’s Inc. 226 233<br />
Kimberley Individual & Family Support Association 1,814 1,545<br />
Kira Inc. 1,364 1,100<br />
Lifeplan Recreation and Leisure Association Inc. 853 749<br />
Lower Great Southern Family Support Association 2,409 1,693<br />
Mandurah Disabled Support & Recreational Respite Inc. 37 31<br />
Midway Community Care Inc. 4,936 3,107<br />
Midwest Community Living Association Inc. 1,904 1,753<br />
116
Name <strong>of</strong> Organisation<br />
2012<br />
$'000<br />
2011<br />
$'000<br />
Mosaic Community Care Inc. 7,309 5,363<br />
My Place (WA) Pty Ltd 19,569 15,227<br />
NASCHA Inc. 1,490 1,244<br />
Nulsen Haven Association Inc. 23,221 18,808<br />
Peel Community Living Inc. 3,689 2,806<br />
People Actively Committed Together 622 506<br />
People with Disabilities 519 349<br />
Phylos Inc 699 541<br />
Pilbara and Kimberley Care<br />
(formerly Pilbara Homecare Service)<br />
165 1,148<br />
PLEDG Inc. 204 185<br />
Rocky Bay Inc. 21,320 15,948<br />
SECCA 309 219<br />
Senses Foundation 6,127 4,328<br />
Southern Cross Care (WA) Inc. 159 156<br />
Spina Bifida Association 202 331<br />
Strive Warren Blackwood Inc. 1,009 568<br />
Teem Treasure Pty Ltd 3,106 2,706<br />
TeenSpirit Inc. 61 51<br />
The Centre for Cerebral Palsy 36,955 27,462<br />
Therapy Focus Inc. 13,383 10,540<br />
Transition and Integration <strong>Services</strong> Pty Ltd 3,495 3,187<br />
Upper Great Southern Family Support Association 1,202 633<br />
Valued Independent People 5,087 3,414<br />
Vemvane Inc. 505 418<br />
WA Blue Sky Inc. 2,680 1,925<br />
We Can Community <strong>Services</strong> Pty Ltd 1,982 1,549<br />
Wheatbelt Individual and Family Support Association 1,577 731<br />
Financial statements<br />
<strong>Disability</strong> <strong>Services</strong> <strong>Commission</strong> • Annual Report 2011–2012 117
Note 34. Supplementary financial information<br />
Write-<strong>of</strong>fs<br />
2012<br />
$'000<br />
2011<br />
$'000<br />
Debts due to the State, written <strong>of</strong>f during the financial year 19 Nil<br />
Losses through theft, defaults and other causes<br />
Losses <strong>of</strong> public moneys and public and other property through<br />
theft or default<br />
Amounts recovered Nil Nil<br />
Gifts <strong>of</strong> public property<br />
Gifts <strong>of</strong> public property provided by the <strong>Commission</strong> Nil Nil<br />
Nil<br />
Nil<br />
118
Note 35. Schedule <strong>of</strong> income and expenses by service<br />
Accommodation<br />
support services<br />
Individual<br />
support<br />
Individual<br />
coordination<br />
Family and<br />
carer support<br />
Community<br />
access and<br />
inclusion<br />
Total<br />
$'000 $'000 $'000 $'000 $'000 $'000<br />
2012 2011 2012 2011 2012 2011 2012 2011 2012 2011 2012 2011<br />
Cost <strong>of</strong> services<br />
Expenses<br />
Employee benefits<br />
expenses<br />
101,770 94,424 26,523 23,388 18,676 16,821 3,855 3,262 1,084 1,184 151,908 139,079<br />
Supplies and<br />
services<br />
14,781 14,712 5,413 4,370 3,187 3,130 1,054 1,139 304 553 24,739 23,904<br />
Depreciation<br />
and amortisation<br />
expense<br />
2,875 2,754 1,500 1,360 - - 571 580 - - 4,946 4,694<br />
Accommodation<br />
expense<br />
6,109 5,224 1,998 1,749 2,079 1,842 719 703 - - 10,905 9,518<br />
Expenditure on<br />
services provided by<br />
funded agencies<br />
258,103 204,213 134,638 100,904 - - 51,258 43,056 - - 443,999 348,173<br />
Individual funding<br />
and other grants<br />
4,533 4,375 2,910 2,894 2,101 1,017 6,048 4,168 - - 15,592 12,454<br />
Loss on disposal <strong>of</strong><br />
non-current assets<br />
43 214 22 106 - - 8 45 - - 73 365<br />
Other expenses 3,085 1,730 1,609 864 - - 613 365 - - 5,307 2,959<br />
Total cost <strong>of</strong> services 391,299 327,646 174,613 135,635 26,043 22,810 64,126 53,318 1,388 1,737 657,469 541,146<br />
Financial statements<br />
<strong>Disability</strong> <strong>Services</strong> <strong>Commission</strong> • Annual Report 2011–2012 119
Note 35. Schedule <strong>of</strong> income and expenses by service (continued)<br />
Accommodation<br />
support services<br />
Individual<br />
support<br />
Individual<br />
coordination<br />
Family and<br />
carer support<br />
Community<br />
access and<br />
inclusion<br />
Total<br />
$'000 $'000 $'000 $'000 $'000 $'000<br />
2012 2011 2012 2011 2012 2011 2012 2011 2012 2011 2012 2011<br />
Income<br />
User charges and<br />
fees<br />
Commonwealth<br />
grants and<br />
contributions<br />
7,997 7,791 - - - - - - - - 7,997 7,791<br />
65,757 57,162 29,303 23,661 4,370 3,982 10,761 9,300 143 303 110,334 94,408<br />
Other revenues 3,511 2,809 1,565 1,162 233 196 575 457 7 15 5,891 4,639<br />
Total income other<br />
than income from<br />
State Government<br />
77,265 67,762 30,868 24,823 4,603 4,178 11,336 9,757 150 318 124,222 106,838<br />
Net cost <strong>of</strong> services 314,034 259,884 143,745 110,812 21,440 18,632 52,790 43,561 1,238 1,419 533,247 434,308<br />
Income from State<br />
Government<br />
Service appropriation 317,322 262,320 141,409 108,581 21,091 18,272 51,932 42,680 691 1,392 532,445 433,245<br />
Resources received<br />
free <strong>of</strong> charge<br />
612 637 273 264 41 44 100 104 1 3 1,027 1,052<br />
Regional community 88 50 39 21 6 4 14 8 - - 147 83<br />
Total income from<br />
State Government<br />
318,022 263,007 141,721 108,866 21,138 18,320 52,046 42,792 692 1,395 533,619 434,380<br />
Surplus/(deficit) for<br />
the period<br />
3,988 3,123 (2,024) (1,946) (302) (312) (744) (769) (546) (24) 372 72<br />
Note: The schedule <strong>of</strong> income and expenses by service should be read in conjunction with the accompanying notes.<br />
120
Note 36. Indian Ocean Territories<br />
The <strong>Commission</strong> provides a full range <strong>of</strong> services to the<br />
residents with disability <strong>of</strong> Christmas and Cocos Islands. The<br />
service is provided pursuant to the service delivery agreement<br />
with the Commonwealth Government.<br />
2012<br />
$'000<br />
2011<br />
$'000<br />
Opening balance 1 July 2011 30 -<br />
Receipt from Commonwealth 67 114<br />
Expenditure (78) (84)<br />
Closing balance 30 June 2012 19 30<br />
Financial statements<br />
<strong>Disability</strong> <strong>Services</strong> <strong>Commission</strong> • Annual Report 2011–2012 121
4.2 Performance indicators<br />
Certification <strong>of</strong> Performance Indicators for the year ended 30 June 2011.<br />
We hereby certify that the performance indicators are based on proper records,<br />
are relevant and appropriate for assisting users to assess the <strong>Disability</strong> <strong>Services</strong><br />
<strong>Commission</strong>’s performance, and fairly represent the performance <strong>of</strong> the <strong>Disability</strong><br />
<strong>Services</strong> <strong>Commission</strong> for the financial year ended 30 June 2011.<br />
Bruce Langoulant<br />
Chairperson<br />
<strong>Disability</strong> <strong>Services</strong> <strong>Commission</strong> Board<br />
7 September 2012<br />
Shayne Silcox<br />
Deputy Chairperson<br />
<strong>Disability</strong> <strong>Services</strong><br />
<strong>Commission</strong> Board<br />
122
Independent auditor’s report<br />
To the <strong>Parliament</strong> <strong>of</strong> <strong>Western</strong> <strong>Australia</strong><br />
DISABILITY SERVICES COMMISSION<br />
Auditor General<br />
Report on the Financial Statements<br />
I have audited the accounts and financial statements <strong>of</strong> the <strong>Disability</strong> <strong>Services</strong><br />
<strong>Commission</strong>.<br />
The financial statements comprise the Statement <strong>of</strong> Financial Position as at 30 June<br />
2012, the Statement <strong>of</strong> Comprehensive Income, Statement <strong>of</strong> Changes in Equity and<br />
Statement <strong>of</strong> Cash Flows for the year then ended, and Notes comprising a summary <strong>of</strong><br />
significant accounting policies and other explanatory information.<br />
Board’s Responsibility for the Financial Statements<br />
The Board is responsible for keeping proper accounts, and the preparation and fair<br />
presentation <strong>of</strong> the financial statements in accordance with <strong>Australia</strong>n Accounting<br />
Standards and the Treasurer’s Instructions, and for such internal control as the Board<br />
determines is necessary to enable the preparation <strong>of</strong> financial statements that are free<br />
from material misstatement, whether due to fraud or error.<br />
Performance indicators<br />
Auditor’s Responsibility<br />
As required by the Auditor General Act 2006, my responsibility is to express an<br />
opinion on the financial statements based on my audit. The audit was conducted in<br />
accordance with <strong>Australia</strong>n Auditing Standards. Those Standards require compliance<br />
with relevant ethical requirements relating to audit engagements and that the audit be<br />
planned and performed to obtain reasonable assurance about whether the financial<br />
statements are free from material misstatement.<br />
An audit involves performing procedures to obtain audit evidence about the amounts<br />
and disclosures in the financial statements. The procedures selected depend on the<br />
auditor’s judgement, including the assessment <strong>of</strong> the risks <strong>of</strong> material misstatement<br />
<strong>of</strong> the financial statements, whether due to fraud or error. In making those risk<br />
assessments, the auditor considers internal control relevant to the <strong>Commission</strong>’s<br />
preparation and fair presentation <strong>of</strong> the financial statements in order to design audit<br />
procedures that are appropriate in the circumstances. An audit also includes evaluating<br />
the appropriateness <strong>of</strong> the accounting policies used and the reasonableness <strong>of</strong><br />
accounting estimates made by the Board, as well as evaluating the overall presentation<br />
<strong>of</strong> the financial statements.<br />
<strong>Disability</strong> <strong>Services</strong> <strong>Commission</strong> • Annual Report 2011–2012 123
Independent auditor’s report (continued)<br />
I believe that the audit evidence obtained is sufficient and appropriate to provide a<br />
basis for my audit opinion.<br />
Opinion<br />
In my opinion, the financial statements are based on proper accounts and present<br />
fairly, in all material respects, the financial position <strong>of</strong> the <strong>Disability</strong> <strong>Services</strong><br />
<strong>Commission</strong> at 30 June 2012 and its financial performance and cash flows for the year<br />
then ended. They are in accordance with <strong>Australia</strong>n Accounting Standards and the<br />
Treasurer’s Instructions.<br />
Report on Controls<br />
I have audited the controls exercised by the <strong>Disability</strong> <strong>Services</strong> <strong>Commission</strong> during the<br />
year ended 30 June 2012.<br />
Controls exercised by the <strong>Disability</strong> <strong>Services</strong> <strong>Commission</strong> are those policies and<br />
procedures established by the Board to ensure that the receipt, expenditure and<br />
investment <strong>of</strong> money, the acquisition and disposal <strong>of</strong> property, and the incurring <strong>of</strong><br />
liabilities have been in accordance with legislative provisions.<br />
Board’s Responsibility for Controls<br />
The Board is responsible for maintaining an adequate system <strong>of</strong> internal control to<br />
ensure that the receipt, expenditure and investment <strong>of</strong> money, the acquisition and<br />
disposal <strong>of</strong> public and other property, and the incurring <strong>of</strong> liabilities are in accordance<br />
with the Financial Management Act 2006 and the Treasurer’s Instructions, and other<br />
relevant written law.<br />
Auditor’s Responsibility<br />
As required by the Auditor General Act 2006, my responsibility is to express an opinion<br />
on the controls exercised by the <strong>Disability</strong> <strong>Services</strong> <strong>Commission</strong> based on my audit<br />
conducted in accordance with <strong>Australia</strong>n Auditing and Assurance Standards.<br />
An audit involves performing procedures to obtain audit evidence about the adequacy<br />
<strong>of</strong> controls to ensure that the <strong>Commission</strong> complies with the legislative provisions. The<br />
procedures selected depend on the auditor’s judgement and include an evaluation <strong>of</strong><br />
the design and implementation <strong>of</strong> relevant controls.<br />
I believe that the audit evidence obtained is sufficient and appropriate to provide a<br />
basis for my audit opinion.<br />
Opinion<br />
In my opinion, the controls exercised by the <strong>Disability</strong> <strong>Services</strong> <strong>Commission</strong> are<br />
sufficiently adequate to provide reasonable assurance that the receipt, expenditure<br />
and investment <strong>of</strong> money, the acquisition and disposal <strong>of</strong> property, and the incurring <strong>of</strong><br />
liabilities have been in accordance with legislative provisions during the year ended 30<br />
June 2012.<br />
124
Report on the Key Performance Indicators<br />
I have audited the key performance indicators <strong>of</strong> the <strong>Disability</strong> <strong>Services</strong> <strong>Commission</strong><br />
for the year ended 30 June 2012.<br />
The key performance indicators are the key effectiveness indicators and the key<br />
efficiency indicators that provide information on outcome achievement and service<br />
provision.<br />
Board’s Responsibility for the Key Performance Indicators<br />
The Board is responsible for the preparation and fair presentation <strong>of</strong> the key<br />
performance indicators in accordance with the Financial Management Act 2006 and<br />
the Treasurer’s Instructions and for such controls as the Board determines necessary to<br />
ensure that the key performance indicators fairly represent indicated performance.<br />
Auditor’s Responsibility<br />
As required by the Auditor General Act 2006, my responsibility is to express an opinion<br />
on the key performance indicators based on my audit conducted in accordance with<br />
<strong>Australia</strong>n Auditing and Assurance Standards.<br />
An audit involves performing procedures to obtain audit evidence about the<br />
key performance indicators. The procedures selected depend on the auditor’s<br />
judgement, including the assessment <strong>of</strong> the risks <strong>of</strong> material misstatement <strong>of</strong> the<br />
key performance indicators. In making these risk assessments the auditor considers<br />
internal control relevant to the Board’s preparation and fair presentation <strong>of</strong> the key<br />
performance indicators in order to design audit procedures that are appropriate in the<br />
circumstances. An audit also includes evaluating the relevance and appropriateness <strong>of</strong><br />
the key performance indicators for measuring the extent <strong>of</strong> outcome achievement and<br />
service provision.<br />
Performance indicators<br />
I believe that the audit evidence obtained is sufficient and appropriate to provide a<br />
basis for my audit opinion.<br />
Opinion<br />
In my opinion, the key performance indicators <strong>of</strong> the <strong>Disability</strong> <strong>Services</strong> <strong>Commission</strong><br />
are relevant and appropriate to assist users to assess the <strong>Commission</strong>’s performance<br />
and fairly represent indicated performance for the year ended 30 June 2012.<br />
Independence<br />
In conducting this audit, I have complied with the independence requirements <strong>of</strong> the<br />
Auditor General Act 2006 and <strong>Australia</strong>n Auditing and Assurance Standards, and other<br />
relevant ethical requirements.<br />
<strong>Disability</strong> <strong>Services</strong> <strong>Commission</strong> • Annual Report 2011–2012 125
Matters Relating to the Electronic Publication <strong>of</strong> the Audited Financial<br />
Statements and Key Performance Indicators<br />
This auditor’s report relates to the financial statements and key performance indicators<br />
<strong>of</strong> the <strong>Disability</strong> <strong>Services</strong> <strong>Commission</strong> for the year ended 30 June 2012 included on the<br />
<strong>Commission</strong>’s website. The <strong>Commission</strong>’s management is responsible for the integrity<br />
<strong>of</strong> the <strong>Commission</strong>’s website. This audit does not provide assurance on the integrity <strong>of</strong><br />
the <strong>Commission</strong>’s website. The auditor’s report refers only to the financial statements<br />
and key performance indicators described above. It does not provide an opinion<br />
on any other information which may have been hyperlinked to/from these financial<br />
statements or key performance indicators. If users <strong>of</strong> the financial statements and key<br />
performance indicators are concerned with the inherent risks arising from publication<br />
on a website, they are advised to refer to the hard copy <strong>of</strong> the audited financial<br />
statements and key performance indicators to confirm the information contained in this<br />
website version <strong>of</strong> the financial statements and key performance indicators.<br />
COLIN MURPHY<br />
AUDITOR GENERAL<br />
FOR WESTERN AUSTRALIA<br />
Perth, <strong>Western</strong> <strong>Australia</strong><br />
13 September 2012<br />
126
Performance indicators<br />
<strong>Disability</strong> <strong>Services</strong> <strong>Commission</strong> • Annual Report 2011–2012 127
Outcomes and services<br />
The table below shows the outcomes and services for which the <strong>Disability</strong> <strong>Services</strong><br />
<strong>Commission</strong> was funded in 2011–2012.<br />
They link to the State Government goal: results-based service delivery—greater focus<br />
on achieving results in key service delivery areas for the benefit <strong>of</strong> all West <strong>Australia</strong>ns.<br />
<strong>Commission</strong>'s desired<br />
outcomes<br />
People with disability access<br />
quality services and supports<br />
that enhance their personal<br />
independence and community<br />
participation<br />
The role <strong>of</strong> family, friends and<br />
carers is actively supported and<br />
the importance <strong>of</strong> their role is<br />
recognised<br />
The West <strong>Australia</strong>n community’s<br />
understanding and inclusion <strong>of</strong><br />
people with disability is enhanced<br />
<strong>Services</strong><br />
Service 1:<br />
Accommodation<br />
support<br />
Service 2:<br />
Individual support<br />
Service 3:<br />
Individual coordination<br />
Service 4:<br />
Family and carer<br />
support<br />
Service 5:<br />
Community access and<br />
inclusion<br />
Service areas<br />
• Hostel residential<br />
• Community<br />
residential<br />
• Supported<br />
community living<br />
• <strong>Disability</strong><br />
pr<strong>of</strong>essional<br />
services<br />
• Day options<br />
(including postschool<br />
options)<br />
• Local Area<br />
Coordination<br />
(provides<br />
information,<br />
advocacy, referral<br />
and support)<br />
• Family support and<br />
respite<br />
• Access and<br />
community<br />
education<br />
128
Performance information<br />
Key effectiveness indicators<br />
Effectiveness indicators provide information on the extent to which the results <strong>of</strong> the<br />
<strong>Commission</strong>’s programs have contributed to the achievement <strong>of</strong> its desired outcomes.<br />
The <strong>Commission</strong> uses a range <strong>of</strong> effectiveness measures. These include take-up rate,<br />
consumer satisfaction, service quality assurance assessments, monitoring the balance<br />
in accommodation service types and performance benchmarking for Local Area<br />
Coordination.<br />
1. Take-up rate<br />
The take-up rate for services is a measure per 1,000 <strong>of</strong> the estimated proportion <strong>of</strong> the<br />
potential population accessing disability services in <strong>Western</strong> <strong>Australia</strong>. This is in line<br />
with the measure adopted by the National <strong>Disability</strong> Agreement.<br />
The West <strong>Australia</strong>n take-up rate is 388 service users per 1,000 people with severe<br />
and/or pr<strong>of</strong>ound disability and is just over five per cent higher than last year. This<br />
means the availability <strong>of</strong> disability services has increased for West <strong>Australia</strong>ns with<br />
disability.<br />
Outcome/s Description 2008<br />
–09<br />
People with<br />
disability<br />
access<br />
quality<br />
services<br />
and<br />
supports<br />
The role<br />
<strong>of</strong> family,<br />
friends and<br />
carers is<br />
actively<br />
supported<br />
and the<br />
importance<br />
<strong>of</strong> their<br />
role is<br />
recognised<br />
Take-up<br />
rate<br />
per 1,000<br />
<strong>Services</strong><br />
1–4<br />
2009<br />
–10<br />
2010<br />
–11<br />
2011<br />
–12<br />
2011<br />
–12<br />
Target<br />
Variation<br />
from<br />
target<br />
2010<br />
– 11<br />
Variation<br />
287 302 368 388 310 25.2% 5. 4%<br />
Performance indicators<br />
Note: The rate for 2010–11 has been re-calculated using the 2009 estimated WA<br />
population with severe and pr<strong>of</strong>ound disability (0-64 years) as the denominator<br />
to reflect a true increase in service reach from 2010–11 to 2011–12. The<br />
denominator is derived from 71,600 in 2003 and 60,300 in 2009 and is taken<br />
from the Survey <strong>of</strong> <strong>Disability</strong>, Ageing and Carers (ABS).<br />
<strong>Disability</strong> <strong>Services</strong> <strong>Commission</strong> • Annual Report 2011–2012 129
The <strong>Commission</strong>’s service reach increased by 1,150 service users from the previous<br />
year and there was a decrease in the estimated WA population (0-64 years) with severe<br />
or pr<strong>of</strong>ound disability. This decrease was not anticipated when the target was set and<br />
has accounted for the notable increase from the target.<br />
2. Consumer satisfaction with services<br />
The <strong>Commission</strong> measures effectiveness on the basis <strong>of</strong> service users' attitudes<br />
toward satisfaction with services. This data is taken from the <strong>Commission</strong>’s consumer<br />
survey conducted annually by an independent market research company contracted by<br />
the <strong>Commission</strong>.<br />
A total <strong>of</strong> 1,421 individuals with disability or their carers were contacted to participate<br />
in a structured telephone interview. The sample was stratified to ensure it contained<br />
individuals representing users across all services funded by the <strong>Commission</strong>. A total <strong>of</strong><br />
745 interviews were completed (52 per cent response rate) and the results provide an<br />
overall confidence interval <strong>of</strong> +/– 3.5 per cent at the 95 per cent level.<br />
Outcome/s<br />
Description<br />
2009<br />
–10<br />
2010<br />
–11<br />
2011<br />
–12<br />
2011<br />
–12<br />
Target<br />
Variation<br />
from<br />
Target<br />
2010<br />
–11<br />
Variation<br />
People with<br />
disability<br />
access quality<br />
services and<br />
supports<br />
The role <strong>of</strong><br />
family, friends<br />
and carers<br />
is actively<br />
supported<br />
and the<br />
importance<br />
<strong>of</strong> their role is<br />
recognised<br />
The West<br />
<strong>Australia</strong>n<br />
community’s<br />
understanding<br />
and inclusion<br />
<strong>of</strong> people with<br />
disability is<br />
enhanced<br />
Aggregated<br />
satisfaction<br />
for <strong>Services</strong><br />
1 to 3<br />
Service 4:<br />
satisfaction<br />
with family<br />
and carer<br />
support<br />
Service 5:<br />
satisfaction<br />
with social<br />
inclusion<br />
and<br />
community<br />
acceptance<br />
81% 79% 81% 85% 4% 2%<br />
82% 89% 86% 85% 1% 3%<br />
n/a See<br />
note<br />
74% 74% 65% 9% 0%<br />
130<br />
Note: Social inclusion and community acceptance satisfaction data for 2009–2010<br />
is unavailable for comparison because the consumer survey was previously<br />
conducted biennially.
Overall consumer satisfaction remained stable despite variations within the individual<br />
services.<br />
The aggregated satisfaction score which reports against the target set under Outcome<br />
One in the Budget Papers comprises satisfaction with accommodation support<br />
(Service 1), individual support (Service 2) and individual coordination (Service 3) and<br />
has a confidence interval <strong>of</strong> +/– 3.2 per cent at the 95 per cent level.<br />
Satisfaction with family and carer support increased on the previous year and has a<br />
confidence interval <strong>of</strong> +/– 5.2 per cent at the 95 per cent level.<br />
Satisfaction with social inclusion and community acceptance has a confidence interval<br />
<strong>of</strong> +/– 3.1 per cent at the 95 per cent level and was nine per cent higher than its target.<br />
As this was a relatively new measure in the consumer survey, a modest baseline target<br />
was set and will be revised for subsequent years based on the obtained results.<br />
3. Compliance with <strong>Disability</strong> Access and Inclusion Plans<br />
Compliance data is collected from government departments that are required to have a<br />
<strong>Disability</strong> Access and Inclusion Plan (DAIP). They are key stakeholders and participants<br />
in the <strong>Commission</strong>’s efforts to meet the State Government’s outcome <strong>of</strong> enhancing the<br />
West <strong>Australia</strong>n community’s understanding and inclusion <strong>of</strong> people with a disability.<br />
Outcome/s<br />
The West<br />
<strong>Australia</strong>n<br />
community’s<br />
understanding<br />
and inclusion<br />
<strong>of</strong> people with<br />
disability is<br />
enhanced<br />
Description<br />
Percentage<br />
<strong>of</strong> State<br />
government<br />
agencies<br />
and local<br />
governments<br />
that have<br />
lodged<br />
<strong>Disability</strong><br />
Access and<br />
Inclusion<br />
Plans with the<br />
<strong>Commission</strong><br />
2010<br />
–11<br />
2011<br />
–12<br />
2011<br />
–12<br />
Target<br />
Variation<br />
from target<br />
2010<br />
–11<br />
Variation<br />
98% 89% 100% 11% 9%<br />
Performance indicators<br />
The majority <strong>of</strong> public authorities have completed or are approaching the end <strong>of</strong> the<br />
first five-yearly cycle <strong>of</strong> developing and implementing DAIPs. The drop in compliance<br />
is a result <strong>of</strong> public authorities currently reviewing their DAIPS and their inability to<br />
lodge their DAIP before the due date. The <strong>Commission</strong> is working with these public<br />
authorities to assist in the preparation <strong>of</strong> new DAIPs and to achieve high levels <strong>of</strong><br />
compliance.<br />
<strong>Disability</strong> <strong>Services</strong> <strong>Commission</strong> • Annual Report 2011–2012 131
4. Quality <strong>of</strong> service<br />
The measure <strong>of</strong> service quality is based on the percentage <strong>of</strong> independently<br />
assessed service points that meet the required nine <strong>Disability</strong> <strong>Services</strong> Standards.<br />
These standards specify the level <strong>of</strong> quality expected <strong>of</strong> services. Reporting the<br />
proportion <strong>of</strong> service points that meet these standards provides a measure <strong>of</strong> the<br />
effectiveness <strong>of</strong> services funded and provided by the <strong>Commission</strong>.<br />
Outcome/s<br />
People with<br />
disability access<br />
quality services and<br />
supports<br />
The role <strong>of</strong> family,<br />
friends and carers is<br />
actively supported<br />
and the importance<br />
<strong>of</strong> their role is<br />
recognised<br />
Description<br />
Percentage<br />
<strong>of</strong> service<br />
points that<br />
met all nine<br />
independently<br />
assessed<br />
quality<br />
assurance<br />
standards<br />
2010<br />
–11<br />
2011<br />
–12<br />
2011<br />
–12<br />
target<br />
Variation<br />
from<br />
target<br />
2010<br />
–11<br />
Variation<br />
76% 63% 70% 7% 13%<br />
Service points are individual services provided by organisations.<br />
A new and more rigorous Quality Management Framework approach was introduced<br />
in 2010-2011. One <strong>of</strong> the consequences has been that this performance indicator has<br />
become more sensitive to issues <strong>of</strong> quality than in previous years. This has caused<br />
significant variation between years on this indicator because even small deviations<br />
from quality are identified.<br />
Quality is evaluated for a sample <strong>of</strong> service points each year and in 2011-2012 the<br />
more rigorous approach discerned the quality <strong>of</strong> the particular sample chosen was less<br />
than would normally be expected. Of those service points considered not satisfactory<br />
on this performance indicator in 2011-2012, the majority (96 per cent) satisfied at least<br />
seven <strong>of</strong> the nine prescribed standards. The effect <strong>of</strong> the variability in this indicator<br />
between years will be assessed in future setting <strong>of</strong> targets.<br />
132
5. Ratio <strong>of</strong> service users in hostels to other community accommodation<br />
The ratio <strong>of</strong> service users in hostels to other community accommodation is a<br />
comparison <strong>of</strong> service users in hostels against community accommodation users. The<br />
ratio is calculated by dividing the number <strong>of</strong> accommodation users in hostels during<br />
the year by the number <strong>of</strong> accommodation users in other accommodation options<br />
(non-hostel) during the year. The intention is to monitor the distribution <strong>of</strong> service users<br />
between more intensive accommodation and less intensive community options.<br />
Outcome/s<br />
People with<br />
disability<br />
access<br />
quality<br />
services and<br />
supports<br />
Service Type<br />
Service 1:<br />
Accommodation<br />
support services<br />
2009<br />
–10<br />
2010<br />
–11<br />
2011<br />
–12<br />
2011<br />
–12<br />
target<br />
Variation<br />
from<br />
target<br />
Variation<br />
from<br />
2010<br />
– 11<br />
1:8 1:9 1:10 1:7 43% 11%<br />
The shift towards a higher proportion <strong>of</strong> service users in community accommodation<br />
reflects the priority given to increasing community-based accommodation alternatives<br />
while maintaining hostel capacity.<br />
Performance indicators<br />
With the increasing uptake <strong>of</strong> community-based care options, the <strong>Commission</strong> will be<br />
reviewing the target accordingly.<br />
<strong>Disability</strong> <strong>Services</strong> <strong>Commission</strong> • Annual Report 2011–2012 133
6. Percentage <strong>of</strong> service users in receipt <strong>of</strong> more than three months <strong>of</strong> full coordination<br />
services who have a shared agreement<br />
This figure measures the effectiveness <strong>of</strong> Local Area Coordination in meeting the<br />
required benchmark to develop a shared agreement with Local Area Coordination<br />
service users. Local Area Coordinators are required to complete a shared agreement<br />
within three months <strong>of</strong> a new contact with a person with disability and their family.<br />
This figure represents the percentage <strong>of</strong> service users in receipt <strong>of</strong> more than three<br />
months <strong>of</strong> full coordination services who had a current shared agreement during the<br />
collection period.<br />
Outcome/s Service Type 2010<br />
–11<br />
2011<br />
–12<br />
2011<br />
–12<br />
target<br />
Variation<br />
from<br />
target<br />
Variation<br />
from<br />
2010<br />
–11<br />
People with disability<br />
access quality<br />
services and supports<br />
The role <strong>of</strong> family,<br />
friends and carers is<br />
actively supported<br />
and the importance <strong>of</strong><br />
their role is recognised<br />
Service 3:<br />
Individual<br />
coordination<br />
90% 90% 91% 1% 0%<br />
The <strong>Commission</strong> continues to maintain its high standard <strong>of</strong> individual coordination<br />
with 90 per cent <strong>of</strong> service users receiving full coordination services and reported being<br />
on a current shared agreement in a timely manner.<br />
134
Efficiency indicators<br />
Key efficiency indicators monitor the relationship between the resources provided for each service and the services delivered. This<br />
input/service relationship places the focus on key services the <strong>Commission</strong> delivers to its service users. The <strong>Commission</strong> has two<br />
efficiency indicators: average cost <strong>of</strong> service outputs and the hourly funding benchmark.<br />
1. Average cost <strong>of</strong> service outputs<br />
The first indicator measures the average cost per service user (or project) for each service and compares these with targets for the<br />
current year and baseline year.<br />
<strong>Services</strong><br />
2009–10<br />
(see note a)<br />
Average Cost Target<br />
2010–11 2011–12 2011–12<br />
Variation<br />
from Target<br />
Variation from<br />
2010–11<br />
Accommodation support<br />
($/service user year)<br />
$97,685 $104,914 $117,155 $103,843 12.8% 11.7%<br />
Individual support<br />
($/service user)<br />
$7,162 $8,143 $9,815 $7,757 26.5% 20.5%<br />
Local Area Coordination<br />
($/registered service user)<br />
$2,614 $2,461 $2,757 $2,920 5.6% 12%<br />
Local Area Coordination<br />
($/service contact)<br />
(see note b)<br />
$71 $72 $62 $74 16.2% 13.9%<br />
Family and carer support<br />
($/service user)<br />
$10,594 $11,018 $13,796 $11,858 16.3% 25.2%<br />
Community access and<br />
inclusion<br />
($/project)<br />
$11,077 $11,979 $10,206 $12,977 21.4% 14.8%<br />
Note (a): The data from 2009–2010 differs from those reported in previous reports as they have been recalculated due to changes in<br />
the reporting framework from four to five service areas.<br />
Note (b): The average cost per Local Area Coordination service contact is derived by subtracting the cost <strong>of</strong> hours spent by Local<br />
Area Coordinators and managers on information and advocacy from the total Local Area Coordination budget. A sub-total for<br />
information and advocacy is derived from this and then divided by the total number <strong>of</strong> information and advocacy contacts.<br />
Performance indicators<br />
<strong>Disability</strong> <strong>Services</strong> <strong>Commission</strong> • Annual Report 2011–2012 135
The cost per user for accommodation support, individual support, and family and<br />
carer support increased due to disability sector organisations receiving an additional<br />
15 per cent <strong>of</strong> funding through Component 1 <strong>of</strong> the initiative for sustainable funding<br />
and contracting with the not-for-pr<strong>of</strong>it sector. This was intended to address long-term<br />
issues in the cost <strong>of</strong> delivering services rather than to increase the number <strong>of</strong> service<br />
users.<br />
The targets were set for the 2010-2011 budget submission prior to the Component 1<br />
payments being finalised and do not reflect the resulting increased average cost per<br />
user.<br />
Additional factors contributing to variations are discussed below:<br />
• Individual support increased above the Component 1 cost increase due to there<br />
being fewer service users than anticipated combined with an increased proportion <strong>of</strong><br />
clients requiring more complex services attributed to the ageing <strong>of</strong> service users and<br />
carers.<br />
• Local Area Coordination (registered service users) shows a variation from 2010-2011<br />
which is caused by a lower than trend average cost for 2010-2011. The 2011-2012<br />
figure is consistent with the long-term trend.<br />
• Local Area Coordination (service contacts) shows a reduced average cost compared<br />
to 2010-2011 due to a decrease in contacts and contact time.<br />
• Family and carer support cost increase above the Component 1 variation is a result<br />
<strong>of</strong> a decrease in service users and the complexity <strong>of</strong> services required by an ageing<br />
population <strong>of</strong> service users and carers.<br />
• Community access and inclusion shows a 14.8 per cent variation from the previous<br />
year and 21.4 per cent variation from target due to a lower number <strong>of</strong> community<br />
projects.<br />
136
2. Hourly funding benchmarks<br />
The second indicator is the hourly funding benchmark. The funding benchmark is the<br />
service cost per hour that represents value for money. The percentage <strong>of</strong> services<br />
operating within these benchmarks provides an appropriate measure <strong>of</strong> fiscal<br />
efficiency.<br />
<strong>Services</strong><br />
Accommodation<br />
support<br />
Individual<br />
support<br />
Family and carer<br />
support<br />
Percentage <strong>of</strong> services within<br />
hourly funding benchmark rate<br />
2010–11 2011–12<br />
Target<br />
2011–12<br />
Variation<br />
from<br />
Target<br />
Variation<br />
from<br />
2010–11<br />
80% 85% 90% 5% 5%<br />
48% 61% 85% 24% 13%<br />
89% 91% 90% 1% 2%<br />
The variation from the previous year’s performance against the hourly funded<br />
benchmark is not significant for accommodation support and family and carer support,<br />
both <strong>of</strong> which are calculated as the median hourly rate within a cost range.<br />
In contrast, the benchmark rate for individual support incorporates a minimum hourly<br />
cost as the benchmark for two services (Alternatives to Employment and Post-School<br />
Options) which has less flexibility and results in a smaller proportion meeting the<br />
benchmark.<br />
Performance indicators<br />
While less than the target, there was a 13 per cent improvement for individual support<br />
services on the previous year as a result <strong>of</strong> improved efficiency. As this reporting<br />
framework is currently in its second year <strong>of</strong> implementation, the <strong>Commission</strong> will be<br />
reviewing the target accordingly.<br />
<strong>Disability</strong> <strong>Services</strong> <strong>Commission</strong> • Annual Report 2011–2012 137
4.3 Other financial disclosures<br />
4.3.1 Pricing policies <strong>of</strong> services provided<br />
The <strong>Commission</strong> charges for goods and services provided on a full or partial cost recovery<br />
basis. Fees and charges generally consist <strong>of</strong> board and lodging charged to people with disability<br />
who live in <strong>Commission</strong> facilities. The rate recovered is generally equivalent to 75 per cent <strong>of</strong> the<br />
residents’ pensions.<br />
4.3.2 Capital works<br />
The <strong>Commission</strong> completed the following major projects in 2011–2012:<br />
• established a Local Area Coordination <strong>of</strong>fice in Fitzroy Crossing<br />
• refurbished Local Area Coordination <strong>of</strong>fices in Manjimup and Marangaroo<br />
• established a new group home in Morley<br />
• refurbished group homes in Bentley and Mirrabooka<br />
• increased the capacity <strong>of</strong> group homes in Maddington and Mandurah.<br />
The following major projects are in progress:<br />
• redevelopment <strong>of</strong> the Bedford emergency accommodation facility<br />
• refurbishment <strong>of</strong> the East Victoria Park <strong>of</strong>fice<br />
• fit-out <strong>of</strong> new Local Area Coordination <strong>of</strong>fices in Busselton, Cannington, Katanning and<br />
Karratha.<br />
4.3.3 Employment and industrial relations<br />
Staff pr<strong>of</strong>ile<br />
During 2011–2012, the <strong>Commission</strong> had an employment level <strong>of</strong> 1,676 full-time<br />
equivalents (FTE). This represents an increase <strong>of</strong> three FTE (0.2 per cent) from the<br />
previous year. The total FTE for the <strong>Commission</strong> has increased by about eight per cent<br />
since 2007–2008.<br />
A total <strong>of</strong> 429 employment contracts were issued by the <strong>Commission</strong> in 2011–2012.<br />
The appointments comprised:<br />
• 173 permanent contracts<br />
• 178 fixed term contracts<br />
• 78 casual contracts.<br />
Comparative staffing levels for the various occupational categories <strong>of</strong> staff between<br />
2007–2008 and 2011–2012 are outlined in the table below.<br />
138
FTE staff growth by occupational category and area 2007–2012<br />
Social<br />
trainers/client<br />
assistants<br />
Registered<br />
nurses<br />
Enrolled<br />
nurses/<br />
nursing<br />
assistants<br />
Support<br />
workers<br />
Direct care<br />
(PSA – see<br />
note)<br />
Total direct<br />
care<br />
Financial years<br />
2007–08 2008–09 2009–10 2010–11 2011–12 % change<br />
842 856 911 916 887 -3.2%<br />
18 18 19 20 18 -10%<br />
7 6 5 0 0 0%<br />
74 73 78 78 75 -3.8%<br />
269 299 293 283 304 7.4%<br />
1,210 1,252 1,306 1,297 1,284 -1%<br />
Administrative 336 333 375 375 392 4.5%<br />
Total 1,546 1,585 1,681 1,672 1,676 8%<br />
Note: Public Service Award direct care staff includes allied health staff, Local Area<br />
Coordinators etc.<br />
Other financial disclosures<br />
<strong>Disability</strong> <strong>Services</strong> <strong>Commission</strong> • Annual Report 2011–2012 139
Equal employment opportunity and diversity<br />
The equity and diversity data in the table below are derived from demographic<br />
information provided by employees on a voluntary basis, through completion <strong>of</strong> a<br />
diversity survey.<br />
Demographic characteristics—participation by employment type as at 30 June<br />
2012<br />
Participation rates Male Female<br />
Culturally and<br />
linguistically<br />
diverse<br />
backgrounds<br />
Aboriginal<br />
and Torres<br />
Strait<br />
Islander<br />
people<br />
People<br />
with<br />
disability<br />
Permanent F/T 496 781 150 6 32<br />
Permanent P/T 40 362 35 4 17<br />
Fixed Term F/T 26 72 6 0 5<br />
Fixed Term P/T 5 45 3 0 3<br />
Casual 29 133 15 1 3<br />
Sessional (Other) 22 37 8 0 1<br />
Other<br />
Total 618 1430 217 11 61<br />
The table below compares the <strong>Commission</strong>’s workforce to the Public Sector workforce<br />
and the West <strong>Australia</strong>n community composition in relation to the different equity<br />
groups. The <strong>Commission</strong>’s Equity and Diversity Management Plan 2011–2014 details<br />
strategies to achieve key objectives and reach its equity and diversity targets.<br />
Equal employment opportunity and diversity<br />
Equity group<br />
Per cent <strong>of</strong> WA<br />
Public Sector<br />
workforce<br />
2011<br />
Per cent <strong>of</strong><br />
<strong>Commission</strong><br />
workforce at<br />
30 June 2011<br />
Per cent <strong>of</strong><br />
<strong>Commission</strong><br />
workforce at<br />
30 June 2012<br />
People with disability 2.8 3.5 3.6<br />
Youth 6.2 5.2 3.6<br />
Aboriginal and Torres<br />
Strait Islander people<br />
People from culturally<br />
diverse backgrounds<br />
2.4 1.1 0.6<br />
11.9 13.5 18.7<br />
Note: Workforce is based on total staff employed by the <strong>Commission</strong> as at 30 June<br />
2011<br />
140
Aboriginal employment strategy<br />
The <strong>Commission</strong> has developed an Aboriginal employment strategy. The key focus is<br />
to ensure that the <strong>Commission</strong> is able to increase Aboriginal staffing levels by exploring<br />
alternative employment options, promoting and understanding Aboriginal culture,<br />
and building stronger Aboriginal community networks and partnerships. This year, the<br />
<strong>Commission</strong> commenced a review <strong>of</strong> the strategy to ensure its effectiveness and to<br />
promote momentum.<br />
Workforce trends<br />
Current indicators 2008–09 2009–10 2010–11 2011–12<br />
Staff headcount as at<br />
30 June 2012<br />
2,157 2,191 2,140 2,048<br />
New permanent staff 222 204 158 173<br />
Staff turnover 10.5% 10.5% 10.5% 10.9%<br />
Annual average staffing<br />
level<br />
Industrial disputes—<br />
days lost<br />
Average accrued annual<br />
leave in days<br />
Average accrued long<br />
service leave in days<br />
Average sick leave<br />
taken in days (see note)<br />
1,585 1,681 1,672 1,676<br />
0 0 0 0<br />
18.9 18.08 19.36 19.5<br />
12.2 12.3 11.59 11.5<br />
10.5 12.3 12.54 13<br />
Overtime in hours/FTE 100 73 66 63<br />
Other financial disclosures<br />
Note: Average sick leave taken (includes sick leave, carers leave and unplanned<br />
personal leave).<br />
<strong>Disability</strong> <strong>Services</strong> <strong>Commission</strong> • Annual Report 2011–2012 141
Workforce planning<br />
The <strong>Commission</strong> is a versatile organisation that comprises a number <strong>of</strong> specialist and<br />
unique services and needs an equally diverse and multifaceted workforce. Workforce<br />
planning is designed to:<br />
• assist managers and senior leaders within the <strong>Commission</strong> in considering key<br />
workforce risks and issues (through workforce data, scenarios and internal/external<br />
analysis)<br />
• develop strategies to address risks and issues to support business needs both now<br />
and into the future.<br />
The <strong>Commission</strong> Workforce Planning Framework details the systems, structure,<br />
processes and people that are involved in this process. Directorates develop individual<br />
directorate workforce plans. The workforce plans for this year have been endorsed and<br />
the implementation <strong>of</strong> these strategies is underway.<br />
Some <strong>of</strong> the significant workforce issues for the <strong>Commission</strong> include:<br />
• an ageing workforce<br />
• the retention <strong>of</strong> corporate knowledge and capability (succession planning)<br />
• mobility and pr<strong>of</strong>essional development<br />
• segmented workforce (by skill, classification, structure and work)<br />
• retention <strong>of</strong> staff in critical roles.<br />
Some initiatives recently undertaken include:<br />
• application <strong>of</strong> a capability framework<br />
• development <strong>of</strong> a training and development framework<br />
• development <strong>of</strong> two online training packages—staff induction and accountable and<br />
ethical decision-making<br />
• enhancement <strong>of</strong> selection processes and systems.<br />
Employee relations and change<br />
Employee Relations<br />
The <strong>Commission</strong> has a range <strong>of</strong> occupational groups including social trainers,<br />
administration staff, Local Area Coordinators, pr<strong>of</strong>essional therapists, support workers<br />
and registered nurses. The composition <strong>of</strong> the <strong>Commission</strong>’s workforce creates a<br />
diverse range <strong>of</strong> challenges and opportunities for the employee relations team.<br />
During the year, the employee relations team provided advice, training and support to<br />
managers and employees on a broad range <strong>of</strong> issues, including:<br />
• interpretation <strong>of</strong> awards, agreements and employment legislation<br />
• performance management, including suspected breaches <strong>of</strong> discipline<br />
• managing incapacitated employees<br />
142
• Code <strong>of</strong> Personal Conduct and the Code <strong>of</strong> Ethics<br />
• change management<br />
• managing employees who are absent without leave<br />
• grievance management, formal and informal disputes and discrimination and<br />
harassment<br />
• deployment and redeployment<br />
• flexible working arrangements<br />
• work value claims and classification matters.<br />
Training sessions were held in 2011–2012 to roll out the guides for performance<br />
management and absence management.<br />
Workplace bargaining and advocacy<br />
In 2011–2012, the employee relations team represented the <strong>Commission</strong> in the<br />
following matters:<br />
• the registration <strong>of</strong> the Registered Nurses–<strong>Australia</strong>n Nursing Federation–<strong>Disability</strong><br />
<strong>Services</strong> <strong>Commission</strong> Industrial Agreement 2010 covering about 25 registered<br />
nurses<br />
• one individual matter brought before the State Administrative Tribunal in relation to<br />
alleged racial discrimination<br />
• three individual matters brought before the <strong>Western</strong> <strong>Australia</strong>n Industrial Relations<br />
<strong>Commission</strong> in relation to access to employee entitlements, employment conditions<br />
and change management.<br />
The <strong>Commission</strong> is preparing for subsequent rounds <strong>of</strong> negotiations for support<br />
workers.<br />
Workplace change<br />
A number <strong>of</strong> directorates within the <strong>Commission</strong> received assistance to support<br />
continuous improvement. Consultation and facilitation were provided during times<br />
<strong>of</strong> organisational change to ensure that transitions were effectively managed, in<br />
accordance with industrial requirements.<br />
Other financial disclosures<br />
<strong>Disability</strong> <strong>Services</strong> <strong>Commission</strong> • Annual Report 2011–2012 143
4.4 Governance disclosures<br />
Contracts with senior <strong>of</strong>ficers<br />
There have been no declarations <strong>of</strong> any interest in any existing or proposed contracts<br />
to senior <strong>of</strong>ficers.<br />
As part <strong>of</strong> its governance framework, the <strong>Commission</strong> has in place, policy and<br />
operational procedures related to conflicts <strong>of</strong> interest. These require all employees to<br />
declare any perceived, potential or real conflicts <strong>of</strong> interest as they arise.<br />
In accordance with the requirements <strong>of</strong> the Public Sector Management Act 1994, the<br />
<strong>Commission</strong>’s Policy and Operational Procedures on Outside Employment requires<br />
all employees to seek permission to engage in both paid and unpaid activities outside<br />
their employment contract. Any conflicts <strong>of</strong> interest must be identified and addressed<br />
by the applicant in his or her submission to the Executive Director <strong>of</strong> Corporate<br />
<strong>Services</strong>. All applicants must seek approval on at least an annual basis.<br />
144
4.5 Other legal requirements<br />
4.5.1 Expenditure on advertising, market research,<br />
polling and direct mail<br />
In accordance with section 175ZE <strong>of</strong> the Electoral Act 1907, the <strong>Commission</strong> incurred<br />
a total <strong>of</strong> $133,914 in relation to advertising, market research, polling, direct mail and<br />
media advertising during the financial year.<br />
Expenditure was incurred in the following areas:<br />
2012<br />
$<br />
Advertising agencies: 128,106<br />
Adcorp <strong>Australia</strong> Ltd 77,662<br />
Albany Advertiser Pty Ltd 1,332<br />
Key2Design Pty Ltd 455<br />
Marketforce Express Pty Ltd 48,657<br />
Market research organisations: 2,648<br />
Integral Development Association 2,648<br />
Polling organisations:<br />
Nil<br />
Direct mail organisations:<br />
Nil<br />
Media advertising organisations: 3,160<br />
Elephant Productions Pty Ltd 1,430<br />
Media 66 1,730<br />
Total 133,914<br />
Other legal requirements<br />
<strong>Disability</strong> <strong>Services</strong> <strong>Commission</strong> • Annual Report 2011–2012 145
4.5.2 Compliance with public sector standards and<br />
ethical codes<br />
In accordance with section 31(1) <strong>of</strong> the Public Sector Management Act 1994, the<br />
<strong>Commission</strong> provides the following statements regarding compliance issues that arose<br />
during 2011–2012 with respect to the public sector standards, the WA Code <strong>of</strong> Ethics,<br />
the <strong>Commission</strong>’s Code <strong>of</strong> Personal Conduct and details <strong>of</strong> any significant action taken<br />
to prevent non-compliance.<br />
Compliance issues<br />
There were 31 allegations received to 30 June 2012 regarding potential breaches <strong>of</strong> the<br />
<strong>Commission</strong>’s Code <strong>of</strong> Personal Conduct and/or the WA Code <strong>of</strong> Ethics, which related<br />
broadly to:<br />
• inappropriate conduct towards colleagues<br />
• inappropriate conduct towards residents<br />
• failure to follow policies, procedures and/or directions.<br />
Actions taken to monitor and ensure compliance<br />
These included:<br />
• training for managers and supervisors on performance management and suspected<br />
breaches <strong>of</strong> discipline in various <strong>Commission</strong> <strong>of</strong>fices<br />
• providing information and training about the <strong>Commission</strong>’s Code <strong>of</strong> Personal<br />
Conduct during staff orientation sessions throughout the year<br />
• maintaining a network <strong>of</strong> support people who assist staff during discipline and<br />
performance processes<br />
• a grievance contact <strong>of</strong>ficer network available to staff for information and support in<br />
relation to grievance issues<br />
• promotion <strong>of</strong> grievance contact <strong>of</strong>ficers and support people during staff orientation<br />
and induction sessions and via the intranet, broadcast emails to staff and posters in<br />
<strong>Commission</strong> facilities.<br />
146
4.5.3 <strong>Disability</strong> Access and Inclusion Plan Outcomes<br />
Under the <strong>Disability</strong> <strong>Services</strong> Act 1993 (amended 2004) public authorities are<br />
required to develop and implement a <strong>Disability</strong> Access and Inclusion Plan (DAIP).<br />
The <strong>Commission</strong> is in its second year <strong>of</strong> implementation <strong>of</strong> its fifth DAIP. The<br />
<strong>Commission</strong> is committed to the access and inclusion <strong>of</strong> people with disability and<br />
aims to continually improve its services, facilities and information.<br />
The <strong>Commission</strong>’s current DAIP (2011–2016) includes many significant initiatives to<br />
ensure that its services, facilities and information are accessible and inclusive.<br />
As required under the Act, the <strong>Commission</strong> has addressed the six outcome areas.<br />
The <strong>Commission</strong> recognises the importance <strong>of</strong> employment for people with disability<br />
and has therefore added a voluntary outcome area relating to employment.<br />
In 2011–2012 the <strong>Commission</strong> implemented a range <strong>of</strong> initiatives.<br />
These are:<br />
Outcome 1: People with disability have the same opportunities as other people to<br />
access the services <strong>of</strong>, and any events organised by the <strong>Commission</strong>.<br />
• New communication technology was identified for residents living in supported<br />
accommodation to use when communicating with family members, visitors and<br />
staff.<br />
• People received invitations to events in accessible formats and were <strong>of</strong>fered<br />
flexible ways to respond.<br />
• Accessible information about the <strong>Commission</strong>’s funding rounds was placed on<br />
the <strong>Commission</strong>’s website.<br />
Other legal requirements<br />
Outcome 2: People with disability have the same opportunities as other people to<br />
access buildings and facilities <strong>of</strong> the <strong>Commission</strong>.<br />
• An annual audit <strong>of</strong> homes managed by Accommodation <strong>Services</strong> was<br />
conducted to ensure access and liveability standards are maintained to a high<br />
standard.<br />
• The Liveable Homes initiative was launched to showcase universal design<br />
principles.<br />
Outcome 3: People with disability receive information from the <strong>Commission</strong> in a<br />
format that will enable them to access the information readily as other people are<br />
able to access it.<br />
• The <strong>Commission</strong>’s website is under review to increase accessibility and quality <strong>of</strong><br />
information.<br />
• <strong>Commission</strong> information and publications are available in a range <strong>of</strong> accessible<br />
formats.<br />
<strong>Disability</strong> <strong>Services</strong> <strong>Commission</strong> • Annual Report 2011–2012 147
Outcome 4: People with disability receive the same level and quality <strong>of</strong> service<br />
from the staff <strong>of</strong> the <strong>Commission</strong> as other people receive from the staff <strong>of</strong> the<br />
<strong>Commission</strong>.<br />
• Local Area Coordinators received information about DAIPs as part <strong>of</strong> their core<br />
training.<br />
• Online staff induction training is under review to include information about equity<br />
and diversity and access and inclusiveness strategies.<br />
Outcome 5: People with disability have the same opportunities as others to make<br />
complaints to the <strong>Commission</strong>.<br />
• The <strong>Commission</strong>’s Consumer Liaison Service provides a supportive and<br />
confidential avenue for people to raise their complaints regarding the<br />
<strong>Commission</strong>’s services without fear or concern that it may adversely influence<br />
their access to services.<br />
• <strong>Commission</strong> staff are regularly provided with information and updates about the<br />
consumer complaints process.<br />
Outcome 6: People with disability have the same opportunities as others to<br />
participate in any public consultation by the <strong>Commission</strong>.<br />
• The <strong>Commission</strong>’s Board facilitates Reference Network meetings in regional and<br />
metropolitan <strong>Western</strong> <strong>Australia</strong>.<br />
Outcome 7: People with disability have improved access to employment<br />
opportunities for people with disability within the <strong>Commission</strong>.<br />
• The <strong>Commission</strong> is working with the Department <strong>of</strong> Training and Workforce<br />
Development to increase the recruitment and retention rates <strong>of</strong> people with<br />
disability through the implementation <strong>of</strong> the Closing the Gap Initiative.<br />
148
4.5.4 Recordkeeping plan and compliance reporting<br />
In accordance with the State Records Act 2000 S61 and the State Records<br />
<strong>Commission</strong>’s Standard 2 Principal 6 the following information is provided:<br />
Efficiency and effectiveness <strong>of</strong> the organisation’s recordkeeping<br />
system<br />
The most recent audit <strong>of</strong> the <strong>Commission</strong>’s recordkeeping systems was conducted in<br />
January 2008 and found that the <strong>Commission</strong> was compliant with the Act. In March<br />
2012, the <strong>Commission</strong>’s reporting compliance was acknowledged at the W.S. Lonnie<br />
Awards where it received the State Records <strong>Commission</strong> Award for Excellence in<br />
Compliance Reporting.<br />
Recordkeeping training program<br />
The <strong>Commission</strong> has in place an online self-paced records awareness training package<br />
specifically developed around the State Records Act 2000. The package is mandatory<br />
for all staff and outlines staff recordkeeping responsibilities and obligations. New staff<br />
are required to complete the training within one month <strong>of</strong> commencement. Since the<br />
start <strong>of</strong> the program in 2006, a total <strong>of</strong> 2,423 staff (87 per cent) have completed the<br />
training.<br />
The training program allows staff to complete an assessment quiz which gauges<br />
the participant’s level <strong>of</strong> understanding <strong>of</strong> their recordkeeping responsibilities and<br />
obligations. The collective average pass mark is monitored to ensure an acceptable<br />
level is reached and also identifies recordkeeping topics that may require<br />
further clarification.<br />
The records awareness training package also allows for participants to provide<br />
comments or queries to the Manager, Corporate Information.<br />
Other legal requirements<br />
As well as the online training program, staff can access information regarding their<br />
recordkeeping responsibilities through various departmental intranet publications.<br />
These include guidelines for the storage and removal <strong>of</strong> information, records practices<br />
for staff and recordkeeping operational procedures.<br />
<strong>Disability</strong> <strong>Services</strong> <strong>Commission</strong> • Annual Report 2011–2012 149
4.6 Government policy requirements<br />
4.6.1 Substantive equality<br />
Background<br />
The <strong>Commission</strong> has been implementing the State Government’s Policy Framework<br />
for Substantive Equality since 2006. This framework has been designed to ensure<br />
that services funded and provided by the <strong>Commission</strong> are culturally accessible and<br />
responsive to the different needs <strong>of</strong> the state’s diverse communities. Substantive<br />
equality recognises that in order to treat people equally you may have to treat them<br />
differently.<br />
The <strong>Commission</strong>’s aim is to provide culturally sensitive and responsive services free<br />
from racial discrimination for all people with disability. This includes Aboriginal<br />
people with disability, their families and carers and people from culturally and<br />
linguistically diverse (CaLD) backgrounds.<br />
The <strong>Commission</strong>’s five-year Substantive Equality Implementation Plan, which began<br />
in 2006, has now been completed. A policy framework is currently under development<br />
and will build on the <strong>Commission</strong>’s achievements to date. This framework will focus on<br />
embedding substantive equality into the <strong>Commission</strong>’s practices and processes.<br />
Progress<br />
The following initiatives were undertaken in 2011–2012:<br />
• the <strong>Commission</strong>’s Substantive Equality Implementation Committee oversaw the<br />
implementation <strong>of</strong> the final project in the <strong>Commission</strong>’s five-year plan for substantive<br />
equality<br />
• the project evaluated the compliance <strong>of</strong> the Positive Behaviour Team (PBT) service<br />
with the principles <strong>of</strong> substantive equality<br />
• the needs and impact assessment report <strong>of</strong> the Positive Behaviour Team was<br />
launched in February 2012. The report identified the need for more culturally<br />
appropriate services for people from Aboriginal and CaLD backgrounds. The<br />
assessment report was nominated for a 2012 Premiers Award by the Equal<br />
Opportunity <strong>Commission</strong><br />
• the <strong>Commission</strong> is developing a booklet that will provide a range <strong>of</strong> examples<br />
illustrating how substantive equality principles can be put into practice to better<br />
meet the needs <strong>of</strong> people from diverse backgrounds<br />
• an external consultant was employed to provide six Aboriginal cross-cultural<br />
awareness training sessions which focussed on effective communication skills, the<br />
provision <strong>of</strong> substantive equality principles and appropriate cultural protocols to<br />
positively engage with Aboriginal people<br />
• the <strong>Commission</strong>’s refreshed Reconciliation Action Plan 2012–2014 was endorsed by<br />
Reconciliation <strong>Australia</strong>.<br />
150
4.6.2 Aboriginal Reconciliation Action Plan<br />
Background<br />
The <strong>Commission</strong> remains committed to providing culturally appropriate information,<br />
supports and services for Aboriginal people with disability, their families and carers<br />
through its Reconciliation Action Plan.<br />
Progress<br />
During 2011–2012 the <strong>Commission</strong>:<br />
• worked closely with the Department <strong>of</strong> Indigenous Affairs in the development <strong>of</strong> the<br />
<strong>Commission</strong>’s Reconciliation Action Plan 2012–2014<br />
• received Reconciliation <strong>Australia</strong>’s endorsement <strong>of</strong> its refreshed Reconciliation<br />
Action Plan 2012–2014<br />
• conducted six Aboriginal cross-cultural awareness training sessions for<br />
<strong>Commission</strong> staff<br />
• sponsored eight banners in the Department <strong>of</strong> Indigenous Affairs, the Bringing Them<br />
Home Committee and the City <strong>of</strong> Perth’s Reconciliation Week banner initiative<br />
• held a Reconciliation Week event, which included storytelling by a local elder and an<br />
afternoon tea for <strong>Commission</strong> staff<br />
• organised and funded across-<strong>Commission</strong> NAIDOC Week celebrations<br />
• continued to provide Aboriginal business trainee opportunities within a variety <strong>of</strong><br />
<strong>Commission</strong> services and programs<br />
• commenced the development <strong>of</strong> the Aboriginal Employment Strategy<br />
implementation plan<br />
• advertised employment opportunities using Aboriginal media.<br />
Government policy requirements<br />
<strong>Disability</strong> <strong>Services</strong> <strong>Commission</strong> • Annual Report 2011–2012 151
4.6.3 Occupational safety and health<br />
Commitment<br />
The <strong>Commission</strong> is committed to ensuring its employees work in a safe and healthy<br />
environment and to providing a safe home for people in its care.<br />
To do this, the <strong>Commission</strong> has:<br />
• met its obligations under the Occupational Safety and Health Act 1984 and the<br />
<strong>Commission</strong>’s Occupational Safety and Health Policy. The policy defines roles and<br />
expectations <strong>of</strong> employees and management in demonstrating leadership and<br />
commitment to safety and health in the workplace. The policy is promoted to staff<br />
at induction and training forums and is accessible though the <strong>Commission</strong>’s intranet<br />
site<br />
• fostered and encouraged consultation on safety matters in the workplace through<br />
its internal communication channels as well as safety and health representatives<br />
and safety champions. Commitment to consultation is evidenced through the<br />
<strong>Commission</strong>’s action plans, policies, procedures and the use <strong>of</strong> the Incident<br />
Management System. It is also reinforced at quarterly safety committee meetings<br />
• improved injury prevention and management in line with the Workers’ Compensation<br />
and Injury Management Act 1981. This is achieved through the continuous<br />
improvement and review <strong>of</strong> its policies and procedures, safety projects, health and<br />
wellness programs and a relationship with RiskCover<br />
• ensured its safety management systems are in place, documented, and audited<br />
in line with AS/NZS4801:2001. A WorkSafe Plan Assessment was conducted late<br />
2010–2011 with another scheduled for 2012–2013. The <strong>Commission</strong> met 80 per<br />
cent <strong>of</strong> the recommendations from the WorkSafe Plan Assessment in 2011–2012.<br />
The recommendations have been and continue to be, implemented through various<br />
projects and initiatives.<br />
Safety System Reviews<br />
In 2011–2012, the <strong>Commission</strong> reviewed its workplace environments, systems,<br />
processes and activities. A range <strong>of</strong> factors influencing the incident and accident<br />
rates <strong>of</strong> its employees were identified. These included an increasing number <strong>of</strong><br />
residents with complex and challenging behaviours, an ageing workforce and<br />
clientele, high employee turnover, high overtime rates and a general lack <strong>of</strong> safety<br />
awareness.<br />
The following system reviews were undertaken and recommendations implemented:<br />
• Consultative Review <strong>of</strong> Safety in the Workplace through workplace focus groups<br />
• Workers’ Compensation and Injury Management Review—an external audit <strong>of</strong> the<br />
<strong>Commission</strong>’s internal claims portfolio, policies and procedures<br />
• Training Needs Analysis—conducted across all <strong>Commission</strong> directorates<br />
• WorkSafe Plan Assessment.<br />
152
Electronic Incident Management System<br />
The <strong>Commission</strong>’s new electronic incident and accident reporting system promotes a<br />
culture <strong>of</strong> increased and improved qualitative reporting. The reporting format<br />
provides prompts, encouraging staff to consider all possible contributory factors as<br />
well as solutions to the issues raised. This has facilitated a marked qualitative<br />
improvement in feedback to relevant managers and the Occupational Safety and<br />
Health Unit fostering positive issue resolution.<br />
Timely advice is now work flowed via e-mail for lost time to the OSH Unit to facilitate<br />
early intervention by way <strong>of</strong> issue resolution and injury management.<br />
Due to the system’s benefits, a number <strong>of</strong> government agencies and disability sector<br />
organisations are in the process <strong>of</strong> adopting the <strong>Commission</strong>’s system to meet their<br />
reporting requirements.<br />
Safety Consultation and Participation<br />
The <strong>Commission</strong>’s 36 safety and health representatives meet on a regular basis.<br />
Meeting attendance increased by 69 per cent while working parties discussed and<br />
reviewed a number <strong>of</strong> topics. These included complex and challenging client<br />
behaviours, use <strong>of</strong> personal protective equipment, management <strong>of</strong> hazardous<br />
chemicals and workplace hazard inspections. Refresher training was also provided<br />
to 24 <strong>of</strong> the safety and health representatives. Corporate Executive also endorsed 10<br />
OSH champions to drive cultural change in the area <strong>of</strong> safety and health at an<br />
operational level.<br />
Safety Training and Development<br />
The <strong>Commission</strong> held 10 safety forums and more than 900 employees participated in<br />
safety training in 2011–2012. Areas <strong>of</strong> training included:<br />
• <strong>of</strong>fice ergonomics<br />
• mental health first aid<br />
• OSH roles and responsibilities<br />
• customised manutention (handling <strong>of</strong> patients) and non-violent crisis intervention<br />
• injury management and workers’ compensation<br />
• emergency evacuation<br />
• management <strong>of</strong> hazardous substances<br />
• risk management<br />
• manual tasks<br />
• slips, trips and falls.<br />
Government policy requirements<br />
<strong>Disability</strong> <strong>Services</strong> <strong>Commission</strong> • Annual Report 2011–2012 153
Positive initiatives to increase safety awareness and wellbeing<br />
• There were 33 safety audits conducted across accommodation facilities.<br />
• Safety action plans were developed across all 85 accommodation facilities.<br />
• The Chemwatch program was purchased to ensure compliance requirements with<br />
material safety data sheets.<br />
• Safety awards were presented to employees for showing initiative and being<br />
proactive in areas <strong>of</strong> workplace safety.<br />
• A number <strong>of</strong> wellness initiatives were put in place, including implementation <strong>of</strong> the<br />
Safe Spine program for high manual task facilities, sports kits for resident and staff<br />
recreation and fitness, mental health workshops and the adoption <strong>of</strong> smoke-free<br />
workplaces across all <strong>Commission</strong> facilities.<br />
154
OSH key performance indicators and trends<br />
Measure<br />
Number <strong>of</strong><br />
fatalities<br />
Lost time injury<br />
and/or disease<br />
incidence rate<br />
Lost time injury<br />
severity rate<br />
Percentage <strong>of</strong><br />
injured workers<br />
returned to work:<br />
2009–<br />
10<br />
2010–<br />
11<br />
2011–12 Target Comment on result<br />
0 0 0 0 Target achieved.<br />
4.8 4.9 4.9<br />
18.8 33.3 23.2<br />
10%<br />
reduction<br />
10%<br />
reduction<br />
(1) Within 13 weeks<br />
(2) Within 26 weeks<br />
85%<br />
94%<br />
83%<br />
94%<br />
88%<br />
98%<br />
Greater<br />
or equal<br />
to 80%<br />
Percentage <strong>of</strong><br />
managers trained<br />
in OSH and injury<br />
management<br />
responsibilities<br />
Lost time injury<br />
and/or diseases<br />
frequency rate<br />
43% 75% 80%<br />
27.3 28.6 28.3<br />
Greater<br />
than or<br />
equal to<br />
80%<br />
10%<br />
reduction<br />
Target not met.<br />
Several workplace<br />
safety initiatives are<br />
currently being<br />
implemented which<br />
should result in a<br />
reduction <strong>of</strong> lost<br />
time incident in the<br />
future.<br />
Target achieved<br />
due to proactive<br />
injury prevention<br />
and management<br />
strategies.<br />
Target achieved<br />
due to improved<br />
early intervention<br />
and injury<br />
management<br />
practices.<br />
Target achieved<br />
due to increased<br />
investment in safety<br />
training for all staff.<br />
Target not met.<br />
Significant workplace<br />
safety initiatives are<br />
currently being<br />
implemented to<br />
reduce the frequency<br />
<strong>of</strong><br />
incidents.<br />
Government policy requirements<br />
<strong>Disability</strong> <strong>Services</strong> <strong>Commission</strong> • Annual Report 2011–2012 155
OSH key performance indicators and trends continued<br />
Number <strong>of</strong> accidents<br />
and incidents<br />
285 555 551<br />
Number <strong>of</strong> lost days 2,440 3,385 4,061<br />
Number <strong>of</strong> workers'<br />
compensation claims<br />
102 127 114<br />
10%<br />
reduction<br />
10%<br />
reduction<br />
10%<br />
reduction<br />
Target not met.<br />
The workplace safety<br />
initiatives currently<br />
being implemented<br />
should result in a<br />
reduced number <strong>of</strong><br />
accidents in the future.<br />
Target not met.<br />
The increase in the<br />
number <strong>of</strong> lost days<br />
is due to a range <strong>of</strong><br />
issues currently being<br />
addressed through<br />
improved prevention,<br />
injury management and<br />
claims management<br />
practices.<br />
Target achieved due to<br />
making safety a priority<br />
through education and<br />
training programs.<br />
Note: Actual results for 2008–2009 reporting period are not available for comparative<br />
purposes.<br />
156
Appendix: Funding to disability sector organisation by service<br />
2011–2012<br />
Number<br />
<strong>Disability</strong> sector<br />
organisation<br />
Service 1<br />
$<br />
Service 2<br />
$<br />
Service 4<br />
$<br />
Total<br />
$<br />
1 Activ Foundation Inc 26,739,956 6,324,794 4,238,812 37,303,562<br />
2<br />
Advocacy South West<br />
(Inc)<br />
116,409 60,724 23,118 200,251<br />
3 Anglicare WA Inc 369,334 629,843 139,321 1,138,498<br />
4<br />
Association for the<br />
Blind <strong>of</strong> <strong>Western</strong><br />
<strong>Australia</strong> (Inc)<br />
0 846,260 35,054 881,314<br />
Appendix<br />
5<br />
6<br />
7<br />
8<br />
ATLAS (Access to<br />
Leisure and Sport) Inc<br />
<strong>Australia</strong>n Red Cross<br />
(Lady Lawley Cottage)<br />
Autism Association <strong>of</strong><br />
WA<br />
Avon Community<br />
Employment Support<br />
Centre<br />
0 23,588 34,449 58,037<br />
2,095,315 0 4,035,324 6,130,639<br />
14,065,608 6,868,486 2,599,626 23,533,720<br />
0 320,797 0 320,797<br />
9 Baptistcare Inc. 9,175,023 2,721,195 2,061,497 13,957,715<br />
10<br />
11<br />
Belmont Districts<br />
Family & Individual<br />
Support Association<br />
Inc.<br />
BGSR Pty Ltd<br />
Supported<br />
Accomodation<br />
<strong>Services</strong><br />
10,870 0 70,155 81,025<br />
3,740,513 0 0 3,740,513<br />
12 Blind Citizens WA Inc 12,770 6,661 2,536 21,967<br />
13<br />
Brightwater Care<br />
Group (Inc)<br />
11,428,599 0 69,748 11,498,347<br />
14 Cam Can & Associates 1,018,571 0 33,879 1,052,450<br />
15<br />
16<br />
Carers’ Association <strong>of</strong><br />
<strong>Western</strong> <strong>Australia</strong><br />
Child & Adolescent<br />
Health Service<br />
80,285 41,880 640,944 763,109<br />
500,706 53,000 0 553,706<br />
17 City <strong>of</strong> Canning 625,842 23,821 202,396 852,059<br />
18 City <strong>of</strong> Fremantle 0 20,618 0 20,618<br />
<strong>Disability</strong> <strong>Services</strong> <strong>Commission</strong> • Annual Report 2011–2012 157
Appendix: Funding to disability sector organisation by<br />
service 2011–2012 continued<br />
158<br />
Number<br />
<strong>Disability</strong> Sector<br />
Organisation<br />
Service 1<br />
$<br />
Service 2<br />
$<br />
Service 4<br />
$<br />
Total<br />
$<br />
19 City <strong>of</strong> Gosnells 0 0 109,670 109,670<br />
20<br />
21<br />
Claremont Therapeutic<br />
Riding Centre<br />
Community Living<br />
Association Inc<br />
(formerly Lower Great<br />
Southern Community<br />
Living Association)<br />
0 56,138 0 56,138<br />
5,148,005 1,809,488 591,553 7,549,046<br />
22 Community Vision Inc 420,361 807,811 676,584 1,904,756<br />
23 Crosslinks 1,999,670 3,113,189 220,957 5,333,816<br />
24 DADAA Inc 182,216 366,533 111,057 659,806<br />
25<br />
26<br />
27<br />
28<br />
Deafness Council <strong>of</strong><br />
WA<br />
Department <strong>of</strong> Health<br />
<strong>of</strong> <strong>Western</strong> <strong>Australia</strong><br />
Developmental<br />
<strong>Disability</strong> Council <strong>of</strong><br />
WA<br />
Directions Family<br />
Support Association<br />
2,259 1,178 449 3,886<br />
3,704,508 192,865 4,063 3,901,436<br />
158,565 82,714 31,490 272,769<br />
235,300 789,585 947,206 1,972,091<br />
29 Elba Inc 5,532,886 694,027 142,529 6,369,442<br />
30<br />
31<br />
32<br />
Enable Southwest Inc<br />
(Formerly SWFSA)<br />
Ethnic <strong>Disability</strong><br />
Advocacy Centre<br />
Fairbridge <strong>Western</strong><br />
<strong>Australia</strong> Inc.<br />
2,216,704 1,851,529 2,168,841 6,237,074<br />
183,884 95,922 36,518 316,324<br />
0 0 92,247 92,247<br />
33 Family Planning WA 0 609,409 0 609,409<br />
34<br />
35<br />
36<br />
Family Support WA Inc<br />
(formerly Landsdale<br />
Family Support)<br />
Goldfields Individual<br />
and Family Support<br />
Headwest (Brain Injury<br />
Association <strong>of</strong> WA Inc.)<br />
701,797 322,647 828,529 1,852,973<br />
1,983,893 944,500 376,771 3,305,164<br />
226,138 117,963 44,910 389,011
Appendix: Funding to disability sector organisation by<br />
service 2011–2012 continued<br />
Number<br />
37<br />
<strong>Disability</strong> Sector<br />
Organisation<br />
Hills Community<br />
Support Group (Inc)<br />
Service 1<br />
$<br />
Service 2<br />
$<br />
Service 4<br />
$<br />
Total<br />
$<br />
6,519,440 2,405,042 1,142,649 10,067,131<br />
38 HomeCare Options 80,303 7,602 116,848 204,753<br />
39 i.d.entity.wa 16,280,990 409,767 2,929,392 19,620,149<br />
40<br />
41<br />
42<br />
Inclusion WA Inc<br />
(formerly Recreation<br />
and Sport Network)<br />
Independence <strong>Australia</strong><br />
(Paraquad Victoria)<br />
Independent Living<br />
Centre<br />
83,538 1,067,082 156,293 1,306,913<br />
0 3,471,779 0 3,471,779<br />
0 3,487,071 0 3,487,071<br />
43 Interchange Inc 0 4,170,322 0 4,170,322<br />
44 Intework 235,156 7,453,076 501,582 8,189,814<br />
45 ISADD WA Pty Ltd 0 830,075 0 830,075<br />
46 Kalparrin Centre 259,494 135,363 73,557 468,414<br />
47 Key Assets WA Ltd 148,103 0 20,069 168,172<br />
48<br />
49<br />
Kids are Kids! Therapy<br />
and Education Centre<br />
Inc.<br />
Kids Biz Therapy<br />
Centre<br />
0 386,775 0 386,775<br />
0 56,196 0 56,196<br />
50 Kids’ Camps Inc 0 0 225,623 225,623<br />
51<br />
Kimberley Individual<br />
and Family Support<br />
Association<br />
760,301 574,273 479,392 1,813,966<br />
52 Kira Inc. 0 1,363,988 0 1,363,988<br />
53 Life Without Barriers 10,144,854 631,209 2,298,362 13,074,425<br />
54<br />
55<br />
Lifeplan Recreation &<br />
Leisure Association Inc<br />
Lifestyle Solutions<br />
(Aust) Ltd<br />
0 853,134 0 853,134<br />
1,765,852 88,318 364,197 2,218,367<br />
Appendix<br />
<strong>Disability</strong> <strong>Services</strong> <strong>Commission</strong> • Annual Report 2011–2012 159
Appendix: Funding to disability sector organisation by<br />
service 2011–2012 continued<br />
160<br />
Number<br />
56<br />
57<br />
58<br />
59<br />
60<br />
61<br />
62<br />
63<br />
<strong>Disability</strong> Sector<br />
Organisation<br />
Lower Great Southern<br />
Family Support<br />
Association<br />
Mandurah Community<br />
Care Inc<br />
Mandurah<br />
Disabled Support &<br />
Recreational Respite<br />
(Inc)<br />
Midway Community<br />
Care<br />
Midwest Community<br />
Living Association Inc<br />
Miscellaneous<br />
Providers<br />
Mosaic Community<br />
Care Inc<br />
Multiple Sclerosis<br />
Society<br />
Service 1<br />
$<br />
Service 2<br />
$<br />
Service 4<br />
$<br />
Total<br />
$<br />
1,264,381 463,644 680,805 2,408,830<br />
291,581 41,148 131,576 464,305<br />
0 37,273 0 37,273<br />
3,264,438 1,012,914 658,309 4,935,661<br />
1,569,579 34,167 300,393 1,904,139<br />
2,343,968 1,120,398 117,561 3,581,927<br />
7,182,848 0 126,051 7,308,899<br />
6,846,565 935,022 1,557,441 9,339,028<br />
64 My Place WA Pty Ltd 15,123,448 2,745,778 1,700,065 19,569,291<br />
65 Nascha Inc 1,256,217 0 233,599 1,489,816<br />
66<br />
67<br />
68<br />
69<br />
70<br />
71<br />
National <strong>Disability</strong><br />
<strong>Services</strong> Limited WA<br />
Next Challenge<br />
Enterprises Pty Ltd<br />
Ngaanyatjarra<br />
Pitjantjatjara<br />
Yankunytjatjara<br />
Women's Council<br />
Noah’s Ark Toy<br />
Library<br />
North Metropolitan<br />
Area Health Service<br />
Nulsen Haven<br />
Association Inc<br />
1,000,487 521,897 198,690 1,721,074<br />
0 66,167 0 66,167<br />
0 0 738,790 738,790<br />
16,247 152,069 3,226 171,542<br />
0 1,009,354 0 1,009,354<br />
20,315,311 2,847,736 57,607 23,220,654
Appendix: Funding to disability sector organisation by<br />
service 2011–2012 continued<br />
Number<br />
<strong>Disability</strong> Sector<br />
Organisation<br />
Service 1<br />
$<br />
Service 2<br />
$<br />
Service 4<br />
$<br />
Total<br />
$<br />
72 One 2 One Pty Ltd 377,535 44,401 16,904 438,840<br />
73 Outcare Inc 1,310,849 7,255 0 1,318,104<br />
74<br />
75<br />
76<br />
Paraplegic<br />
Quadriplegic<br />
Association<br />
Peel Community Living<br />
Inc<br />
People Actively<br />
Committed Together<br />
1,278,232 283,968 623 1,562,823<br />
3,144,788 484,442 59,715 3,688,945<br />
293,513 0 328,020 621,533<br />
77 People With Disabilities 301,421 157,234 59,860 518,515<br />
78<br />
79<br />
Personal Advocacy<br />
Service<br />
Perth Home Care<br />
<strong>Services</strong><br />
68,194 35,573 13,543 117,310<br />
17,102,573 3,063,508 4,855,219 25,021,300<br />
80 Phylos Inc 699,408 0 0 699,408<br />
81<br />
Pilbara and Kimberley<br />
Care Inc<br />
-11,198 67,891 108,134 164,827<br />
82 Pledg Projects 118,348 61,736 23,503 203,587<br />
83<br />
84<br />
Richmond Fellowship<br />
<strong>of</strong> <strong>Western</strong> <strong>Australia</strong><br />
Inc<br />
Riding for the Disabled<br />
Association <strong>of</strong> WA<br />
256,505 0 0 256,505<br />
0 293,255 0 293,255<br />
85 Rocky Bay Inc 5,461,457 12,645,832 3,212,740 21,320,029<br />
86 SECCA 0 308,738 0 308,738<br />
87<br />
88<br />
89<br />
90<br />
Senses Foundation<br />
(Inc)<br />
Seventh Day Adventist<br />
Aged Care WA<br />
Silver Chain Nursing<br />
Association<br />
South Metropolitan<br />
Area Health Service<br />
3,828,301 1,897,445 401,341 6,127,087<br />
1,195,422 0 0 1,195,422<br />
0 504,787 0 504,787<br />
0 3,337,696 0 3,337,696<br />
<strong>Disability</strong> <strong>Services</strong> <strong>Commission</strong> • Annual Report 2011–2012 161<br />
Appendix
Appendix: Funding to disability sector organisation by<br />
service 2011–2012 continued<br />
162<br />
Number<br />
91<br />
92<br />
93<br />
94<br />
<strong>Disability</strong> Sector<br />
Organisation<br />
South Metropolitan<br />
Personnel (Lifeskills 2<br />
Work Fremantle)<br />
Southern Cross Care<br />
(WA) Inc<br />
Spina Bifida<br />
Association<br />
Strive Warren<br />
Blackwood<br />
Service 1<br />
$<br />
Service 2<br />
$<br />
Service 4<br />
$<br />
Total<br />
$<br />
0 2,057,557 0 2,057,557<br />
158,848 0 0 158,848<br />
36,163 159,122 7,183 202,468<br />
517,788 345,747 145,344 1,008,879<br />
95 Teem Treasure 3,106,356 0 0 3,106,356<br />
96<br />
97<br />
98<br />
99<br />
100<br />
TeenSpirit<br />
Incorporated<br />
Telethon Institute for<br />
Child Health Research<br />
Telethon Speech and<br />
Hearing Centre for<br />
Children<br />
The Centre for<br />
Cerebral Palsy<br />
The Friends <strong>of</strong><br />
David Guhl<br />
0 0 61,315 61,315<br />
31,060 16,202 6,168 53,430<br />
0 458,910 0 458,910<br />
16,811,684 15,970,521 4,173,091 36,955,296<br />
0 0 10,000 10,000<br />
101 The Spiers Centre Inc 0 0 14,545 14,545<br />
102 Therapy Focus Inc 0 13,382,978 0 13,382,978<br />
103<br />
104<br />
Transition &<br />
Integration <strong>Services</strong><br />
UnitingCare<br />
Crossroads<br />
2,928,579 385,109 181,796 3,495,484<br />
0 0 59,422 59,422<br />
105 UnitingCare West 3,284,645 20,086 28,095 3,332,826<br />
106<br />
107<br />
Upper Great Southern<br />
Family Support<br />
Valued Independent<br />
People<br />
605,043 413,843 182,815 1,201,701<br />
406,913 4,413,806 266,749 5,087,468<br />
108 Vemvane 73,650 0 430,917 504,567<br />
109 WA Blue Sky Inc 2,497,068 183,320 0 2,680,388
Appendix: Funding to disability sector organisation by service<br />
2011–2012 continued<br />
Number<br />
110<br />
<strong>Disability</strong> Sector<br />
Organisation<br />
WA Country<br />
Health Service<br />
Service 1<br />
$<br />
Service 2<br />
$<br />
Service 4<br />
$<br />
Total<br />
$<br />
0 2,084,288 0 2,084,288<br />
111 WA Deaf Society 70,170 159,571 0 229,741<br />
112<br />
113<br />
114<br />
WA Disabled<br />
Sports<br />
Association Inc<br />
We Can<br />
Community<br />
<strong>Services</strong> Pty Ltd<br />
West <strong>Australia</strong>n<br />
Sleep Disorders<br />
Research Institute<br />
(Inc)<br />
0 239,391 0 239,391<br />
1,435,676 326,637 219,993 1,982,306<br />
0 212,451 0 212,451<br />
115 Westcare Inc 270,172 0 0 270,172<br />
116<br />
117<br />
118<br />
119<br />
120<br />
<strong>Western</strong><br />
<strong>Australia</strong>n<br />
Motor Industry<br />
Foundation Inc<br />
Wheatbelt<br />
Individual and<br />
Family Support<br />
Wize Therapy Pty<br />
Ltd<br />
Workpower<br />
Incorporated<br />
Yaandina Family<br />
Centre Inc<br />
Total for<br />
disability sector<br />
organisations<br />
232,526 121,296 46,178 400,000<br />
484,604 130,359 962,055 1,577,018<br />
0 282,550 0 282,550<br />
0 1,904,545 0 1,904,545<br />
297,737 0 0 297,737<br />
258,103,118 134,637,854 51,257,578 443,998,550<br />
Appendix<br />
Note: Some disability sector organisations receive funding for information and/or<br />
advocacy for the sector and are not restricted to any one service. These funds<br />
are distributed across services 1, 2 and 4 according to their proportionate<br />
overall budgets.<br />
<strong>Disability</strong> <strong>Services</strong> <strong>Commission</strong> • Annual Report 2011–2012 163
<strong>Disability</strong> <strong>Services</strong> <strong>Commission</strong><br />
146–160 Colin Street<br />
West Perth, WA 6005<br />
PO Box 441<br />
Phone: 9426 9200<br />
Freecall (country): 1800 998 214<br />
Fax: 9226 2306<br />
TTY: 9426 9315<br />
National Relay Service: 13 36 77<br />
Email: dsc@dsc.wa.gov.au<br />
Website: www.disability.wa.gov.au<br />
DSC: 2206-14-09-2012<br />
© <strong>Disability</strong> <strong>Services</strong> <strong>Commission</strong>. September 2012.<br />
This publication is available in alternative formats on request.