

EIPOT Final Project Report - Stockholm Environment Institute
EIPOT Final Project Report - Stockholm Environment Institute
EIPOT Final Project Report - Stockholm Environment Institute

Create successful ePaper yourself
Turn your PDF publications into a flip-book with our unique Google optimized e-Paper software.
ERA-NET SKEP <strong>Project</strong> <strong>EIPOT</strong> (www.eipot.eu)<br />
“Development of a methodology for the assessment of global environmental impacts of traded goods and services”<br />
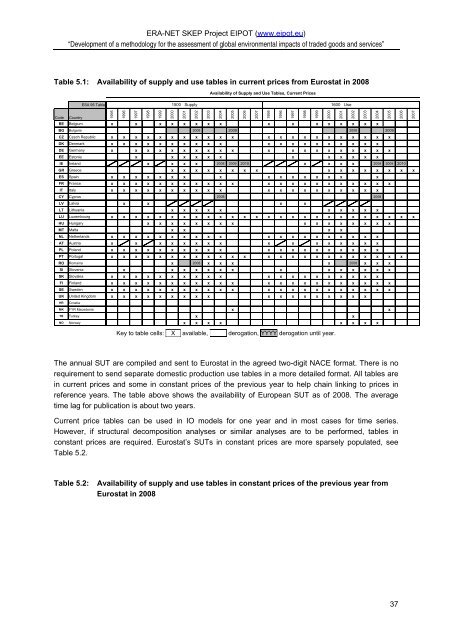
Table 5.1: Availability of supply and use tables in current prices from Eurostat in 2008<br />
Availability of Supply and Use Tables, Current Prices<br />
ESA 95 Table<br />
1500 Supply<br />
1600 Use<br />
Code Country<br />
1995<br />
1996<br />
1997<br />
1998<br />
1999<br />
2000<br />
2001<br />
2002<br />
2003<br />
2004<br />
2005<br />
2006<br />
2007<br />
1995<br />
1996<br />
1997<br />
1998<br />
1999<br />
2000<br />
2001<br />
2002<br />
2003<br />
2004<br />
2005<br />
2006<br />
2007<br />
BE Belgium x x x x x x x x x x x x x x x x<br />
BG Bulgaria 2008 2009 2008 2009<br />
CZ Czech Republic x x x x x x x x x x x x x x x x x x x x x x<br />
DK Denmark x x x x x x x x x x x x x x x x x x x x<br />
DE Germany x x x x x x x x x x x x x x x x x x x x<br />
EE Estonia x x x x x x x x x x x x<br />
IE Ireland x x x x 2008 2009 2010 x x x x 2008 2009 2010<br />
GR Greece x x x x x x x x x x x x x x x x<br />
ES Spain x x x x x x x x x x x x x x x x<br />
FR France x x x x x x x x x x x x x x x x x x x x x x<br />
IT Italy x x x x x x x x x x x x x x x x x x x x<br />
CY Cyprus 2008 2008<br />
LV Latvia x x x x<br />
LT Lithuania x x x x x x x x x x<br />
LU Luxembourg x x x x x x x x x x x x x x x x x x x x x x x x x x<br />
HU Hungary x x x x x x x x x x x x x x x x<br />
MT Malta x x x x<br />
NL Netherlands x x x x x x x x x x x x x x x x x x x x<br />
AT Austria x x x x x x x x x x x x x x x x<br />
PL Poland x x x x x x x x x x x x x x x x x x x x<br />
PT Portugal x x x x x x x x x x x x x x x x x x x x x x x x<br />
RO Romania x 2008 x x x x 2008 x x x<br />
SI Slovenia x x x x x x x x x x x x x x<br />
SK Slovakia x x x x x x x x x x x x x x x x x x x x<br />
FI Finland x x x x x x x x x x x x x x x x x x x x x x<br />
SE Sweden x x x x x x x x x x x x x x x x x x x x x x<br />
UK United Kingdom x x x x x x x x x x x x x x x x x x<br />
HR Croatia<br />
MK FYR Macedonia x x<br />
TR Turkey x x<br />
NO Norway x x x x x x x x<br />
Key to table cells: X available, XXXX derogation, YYYY derogation until year.<br />
The annual SUT are compiled and sent to Eurostat in the agreed two-digit NACE format. There is no<br />
requirement to send separate domestic production use tables in a more detailed format. All tables are<br />
in current prices and some in constant prices of the previous year to help chain linking to prices in<br />
reference years. The table above shows the availability of European SUT as of 2008. The average<br />
time lag for publication is about two years.<br />
Current price tables can be used in IO models for one year and in most cases for time series.<br />
However, if structural decomposition analyses or similar analyses are to be performed, tables in<br />
constant prices are required. Eurostat’s SUTs in constant prices are more sparsely populated, see<br />
Table 5.2.<br />
Table 5.2:<br />
Availability of supply and use tables in constant prices of the previous year from<br />
Eurostat in 2008<br />
37


